
Epsilon-Delta Definition for Limits
Loading the math board and drawing, please wait…
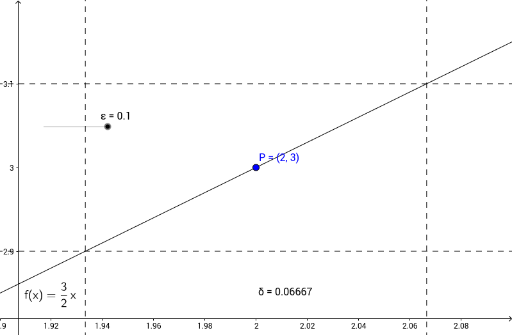
This example illustrates the ε-δ definition of limits, showing how to approach the limit value of a function by adjusting ε and δ. Key mathematical concepts include limits, functions, and inequalities. GeoGebra commands used include Min and objects such as f, ε, c, L, δ. Suitable for university-level calculus courses.
GeoGebra Commands & Parameters
Min((2 * ε / 3), 1) → δ
AI Drawing Prompt Reference
Create a diagram illustrating the epsilon-delta definition of a limit. Draw a function curve and mark a point on it at (c, L). Around the y-value L, draw two horizontal dashed lines at L+ε and L-ε, representing the epsilon neighborhood. Around the x-value c, draw two vertical dashed lines at c+δ and c-δ, representing the delta neighborhood. The value of δ is determined as the minimum of (2ε/3) and 1. Show clearly that when x lies within the delta neighborhood of c, the function values lie within the epsilon neighborhood of L. Use arrows or shading to indicate these neighborhoods and label the symbols ε, δ, c, and L.
The prompt above was compiled from the original drawing commands and is for reference only.