
Derivative Practice: Interactive Function Differentiation and Visualization
Loading the math board and drawing, please wait…
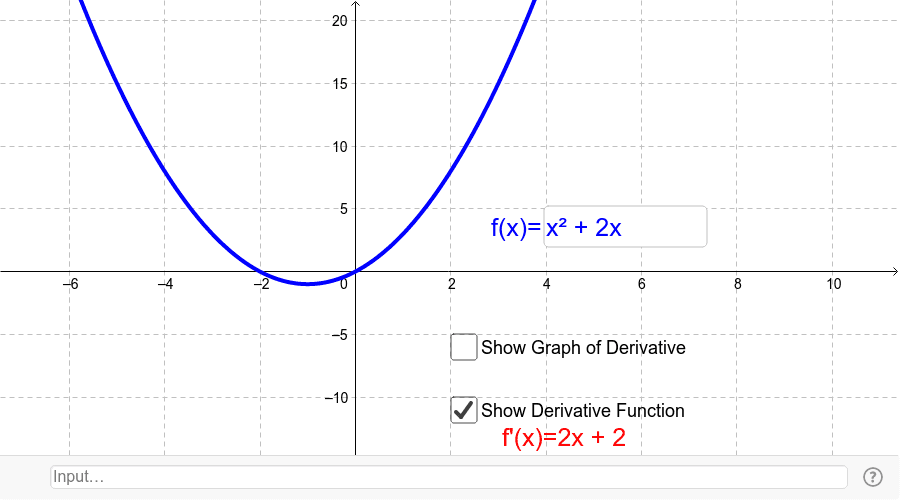
This interactive GeoGebra example serves as a derivative practice tool, allowing users to input a function and automatically compute its derivative, while displaying both the original function and its derivative graph. It visually demonstrates the geometric meaning of derivatives, such as the slope of tangent lines and the relationship between a function and its rate of change. Core mathematical concepts include the definition of the derivative, differentiation rules (e.g., power rule, exponential functions), and the connection between derivatives and monotonicity. The construction uses the Textfield command to create an input box for the function f, the Derivative command to generate the derivative function g, a slider a to explore specific points, and text objects to display values. This resource is ideal for high school and introductory college calculus students, supporting classroom demonstrations or self-study with immediate feedback to reinforce understanding of derivative concepts and computation.
GeoGebra Commands & Parameters
Textfield(f) → inputBox1Derivative(f) → g
AI Drawing Prompt Reference
Create an interactive derivative practice graph. First, place a function input box where a user can enter a function. Then automatically compute its derivative and draw both the original function and the derivative curve in the same coordinate system. Add a slider to select a point on the graph, and use text labels to show the function value, derivative value, or tangent slope at that point. The visualization should make clear that the derivative represents instantaneous rate of change, tangent slope, and the connection to monotonicity, supporting classroom demonstration or self-study.
The prompt above was compiled from the original drawing commands and is for reference only.