
Derivative Plot from a Function
Loading the math board and drawing, please wait…
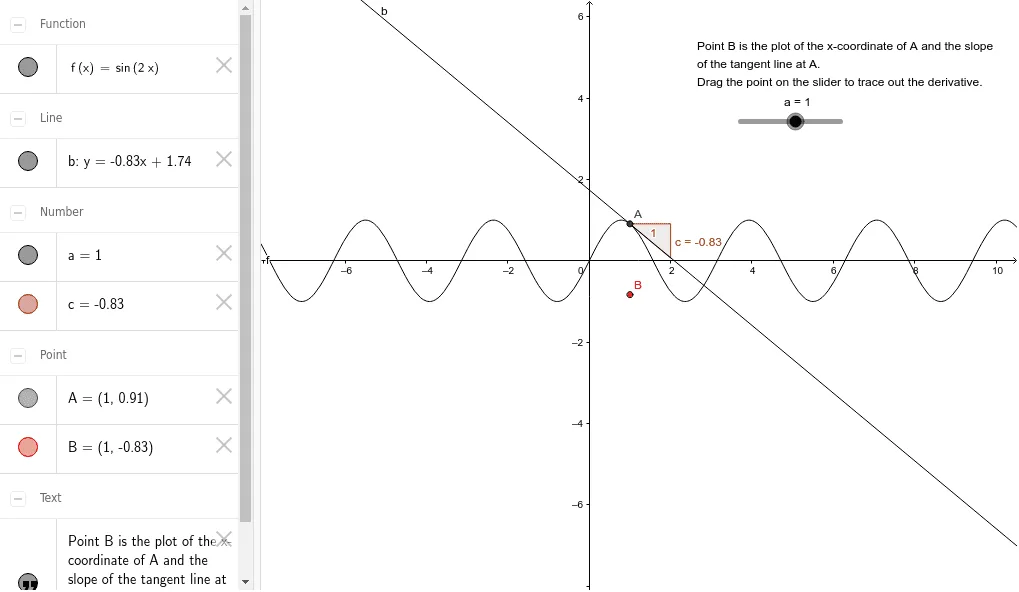
①This example dynamically demonstrates the geometric meaning of the derivative by showing the slope of the tangent line at a point on a function's graph. ②Core mathematical concepts include the derivative as the instantaneous rate of change, tangent line slope, and the relationship between a function and its derivative; it also incorporates polynomial functions, hyperbolas, ellipses, and isosceles triangles as visual elements. ③Construction details: using GeoGebra commands Tangent to create the tangent line at point A on function f, Intersect to find intersection points (e.g., B) with axes or other objects, Slope to compute the tangent's slope, and a text object text1 to display the slope value; key objects include f, A, c, B, and text1. ④Suitable for high school or introductory college calculus students to explore the derivative concept, and for teachers to use in classroom demonstrations or student self-study.
GeoGebra Commands & Parameters
Tangent(a, f) → bIntersect(f, b, (1.0000000078885687, 0.9092974202600758)) → ASlope(b) → c