
Derivative of aSin(bx) Visualization
Loading the math board and drawing, please wait…
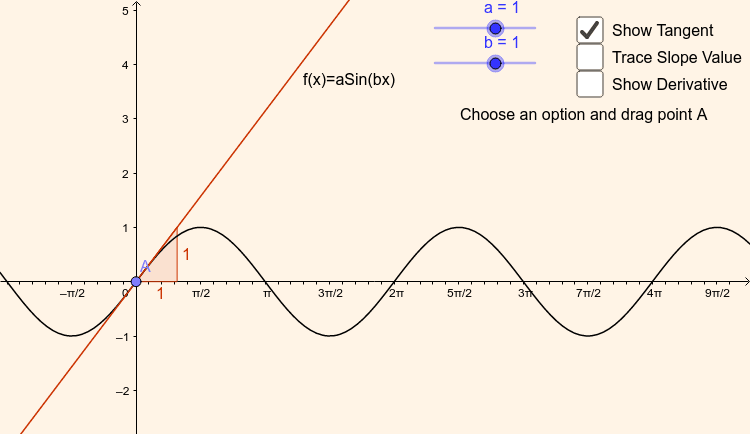
This example demonstrates how to use GeoGebra to plot the function y=a*sin(bx) and its derivative y'=a*b*cos(bx). By dynamically adjusting parameters a and b, one can intuitively observe the effects of parameter changes on the graphs of the original function and its derivative. Key math concepts include derivatives, trigonometric functions, analytical geometry, and function graphing. Construction highlights the use of GeoGebra commands like Point, Tangent, and Slope, along with objects such as a, b, f, g, e, A, c, d, text1, m, B, h, text2. Suitable for high school and above students to explore the integration of calculus and trigonometry.
GeoGebra Commands & Parameters
Point(f) → ATangent(A, f) → cSlope(c) → m