
Derivative Intuition 2: Connecting Tangent Slope to Derivative Value
Loading the math board and drawing, please wait…
In collections
AP Calculus AB Applet Collection
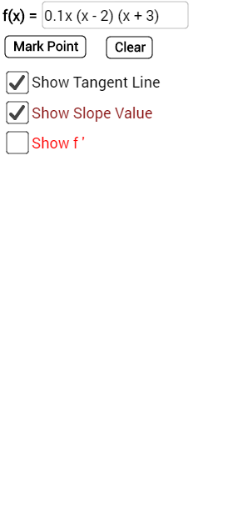
①This example dynamically illustrates the relationship between the slope of the tangent line at a point on a function's graph and the value of the derivative at that point, building geometric intuition for the derivative concept. ②Core mathematical concepts include the derivative as an instantaneous rate of change, the geometric interpretation of the derivative as the slope of the tangent line, and the behavior of functions and their tangent lines. ③Construction details: Using GeoGebra commands such as Point, Line, Slope, Textfield, and Segment, the applet includes the function f, a movable tangent point TanPt, the tangent line tanline, the slope value AdjSlope, and a derivative point DerPt. Interactive elements include buttons btnMark and btnClr for marking/clearing points, checkboxes chkShowDerF, chkShowSlope, and chkShowTanLine to toggle displays, an input field inpF for entering a custom function, and auxiliary segments xseg, dseg, yseg along with text1 for labeling. ④Suitable for high school or introductory college calculus students, this tool supports classroom demonstrations or self-guided exploration, allowing learners to drag the tangent point and observe how the slope changes, thereby understanding the derivative as the tangent slope and distinguishing between function values and derivative values.
GeoGebra Commands & Parameters
Point(f) → TanPtLine(AdjSlope, TanPt) → tanlineSlope(tanline) → mTextfield(f) → inpFSegment(TanPt, (x(TanPt), 0)) → xsegSegment(TanPt, DerPt) → dsegSegment(DerPt, (0, y(DerPt))) → yseg
AI Drawing Prompt Reference
Draw a function graph with a draggable point on it. Construct the tangent line at that point and display its slope value. Drop a perpendicular segment from the tangent point to the x-axis, connect the tangent point to a derivative point whose y-coordinate equals the slope, and drop another perpendicular from that derivative point to the y-axis. Include an input field to change the function, checkboxes to toggle the derivative curve, slope value, and tangent line, and two buttons to mark or clear points on the graph.
The prompt above was compiled from the original drawing commands and is for reference only.