
Derivative Exploration by Tom Ahlschwede (2)
Loading the math board and drawing, please wait…
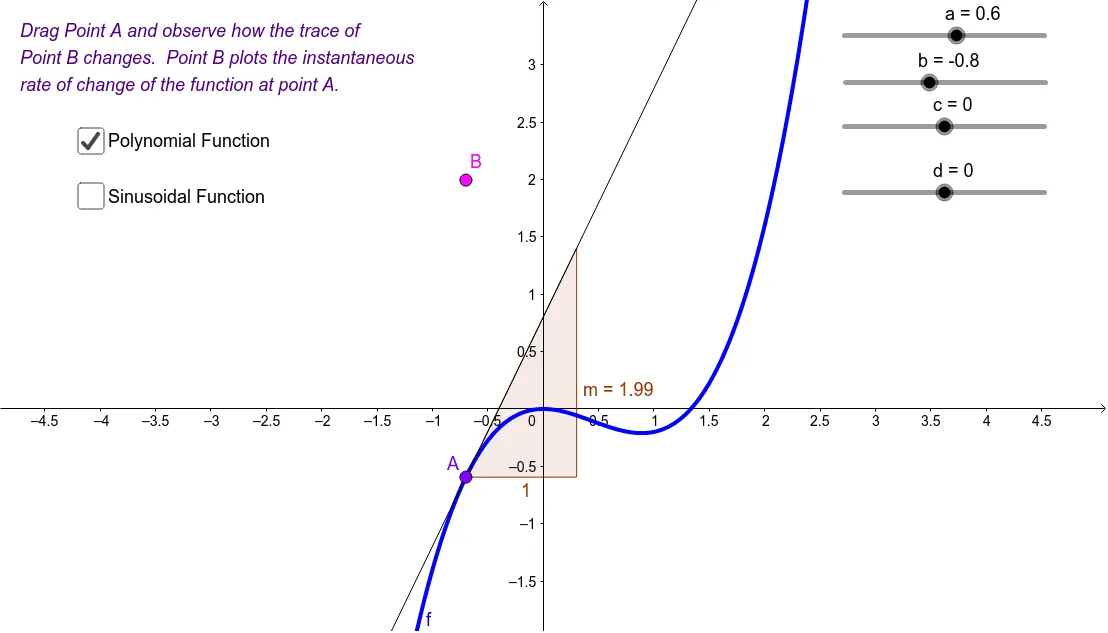
This example demonstrates polynomial and sinusoid functions, allowing users to drag a point to see the slope of the tangent line. Key math concepts include derivatives, tangent lines, slopes, and function graphs. Constructed using GeoGebra commands like Point, Tangent, and Slope. Suitable for high school mathematics teaching or self-learning to understand the geometric meaning of derivatives.
GeoGebra Commands & Parameters
Point(f) → ATangent(A, f) → eSlope(e) → mPoint(g) → CTangent(C, g) → hSlope(h) → m_1
AI Drawing Prompt Reference
Draw a coordinate plane with two function curves: one polynomial and one sinusoidal. Place a draggable point on each curve, and draw a tangent line through each point to its respective curve. Display the slope value next to each tangent line, updating in real time as the point moves. The graph should clearly show how the tangent line locally aligns with the curve at the point of tangency, and how the slope represents the derivative's geometric meaning. Arrange the elements for easy comparison of the two curves, their tangents, and slope values.
The prompt above was compiled from the original drawing commands and is for reference only.