
Derivative Exercises: Function Graphs and Derivative Relationships
Loading the math board and drawing, please wait…
In collections
₁ΛM 0 -Critical points and their nature using hessian matrix
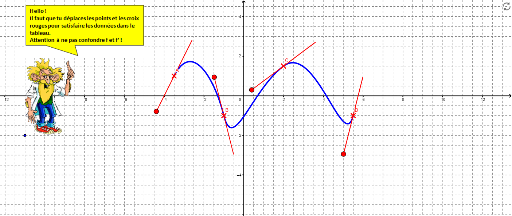
This example demonstrates the geometric meaning of function graphs and their derivatives, enhancing understanding of the derivative concept through dynamic visualization. Core mathematical concepts include derivatives, function graphs, tangents, and geometric transformations. GeoGebra commands/objects used in construction are RandomElement, OrthogonalLine, Circle, Intersect, CircleArc, FractionText, Point, Mirror, Segment, Slope, Beziers, TableText, Line, Ray, and Corner. Suitable for high school students learning calculus, this tool aids in grasping the intuitive relationship between derivatives and function graphs, improving geometric construction skills.
GeoGebra Commands & Parameters
RandomElement(list2) → H1OrthogonalLine(B, xAxis) → f_1Circle(B, If[niv ≟ 1, 2, 3]) → dIntersect(d, f_1) → K, QCircleArc(B, Q, K) → d_1RandomElement(list2) → H4FractionText(H4) → I4RandomElement(list2) → H3FractionText(H3) → I3RandomElement(list2) → H2FractionText(H2) → I2FractionText(H1) → I1OrthogonalLine(A, xAxis) → aCircle(A, If[niv ≟ 1, 2, 3]) → cIntersect(c, a) → F, HCircleArc(A, H, F) → c_1Point(c_1) → IMirror(I, A) → I'Segment(I, I') → eSlope(e) → a_1RandomElement(liste0) → C1RandomElement(liste0) → C4RandomElement(liste0) → C3RandomElement(liste0) → C2Point(d_1) → JMirror(J, B) → J'Segment(J, J') → fCircle(C, If[niv ≟ 1, 2, 3]) → gPoint(g) → GMirror(G, C) → G'Segment(G, G') → hCircle(D, If[niv ≟ 1, 2, 3]) → kPoint(k) → LMirror(L, D) → L'Segment(L, L') → jSlope(f) → vSlope(h) → a_2Slope(j) → a_3Beziers(A, I', J, B) → bBeziers(B, J', G, C) → iBeziers(C, G', L, D) → lTableText({{A6, B6}, {A7, B7}, {A8, B8}, {A9, B9}, {A10, B10}}, "|_") → texte3TableText({{G14, H14}, {G15, H15}, {G16, H16}, {G17, H17}, {G18, H18}}, "|_ll") → texte5Line(A, I) → tOrthogonalLine(C, xAxis) → g_1OrthogonalLine(D, xAxis) → h_1Intersect(k, h_1) → T, UCircleArc(D, U, T) → k_1Circle(A, 1) → e_1Circle(B, 1) → p_1Circle(C, 1) → q_1Circle(D, 1) → r_1Intersect(e_1, e) → R, SIntersect(p_1, f) → V, WIntersect(r_1, h) → Z,Intersect(r_1, j) → E_1, F_1Ray(A, S) → i_1Ray(B, W) → j_1Intersect(q_1, h) → G_1, H_1Ray(D, F_1) → l_1Ray(C, H_1) → m_1Slope(i_1) → a_4Slope(j_1) → a_5Slope(m_1) → a_6Slope(l_1) → a_7Corner(1) → I_1Corner(2, 1) → K_1Corner(2, 2) → L_1Corner(2, 3) → M_1Corner(2, 4) → N_1
AI Drawing Prompt Reference
Draw a graph of a function and its derivative relationship. Start by plotting the function and its tangent at a specific point, then generate related shapes through mirroring and rotating, including the mirror images of tangents and function graphs, and their connecting lines. Use Bézier curves to link key points, forming a dynamic geometric figure that illustrates the relationship between the function and its derivative.
The prompt above was compiled from the original drawing commands and is for reference only.