
Derivative Example
Loading the math board and drawing, please wait…
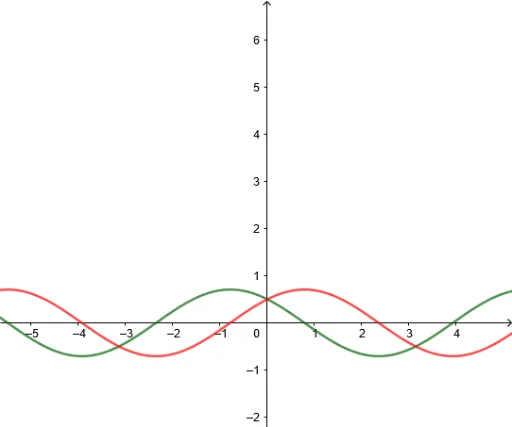
This example demonstrates how to use GeoGebra to plot the derivative of a function and show the relationship between the tangent function and rectangles. The core math concepts involved include derivatives, tangent functions, curve sketching, and bar charts. Key construction points use GeoGebra objects g and f to build function and derivative graphs. Suitable for high school mathematics teaching and introductory calculus learners.
GeoGebra Commands & Parameters
g(x) = (1 / 2 * (cos(x) + sin(x)))Function f
AI Drawing Prompt Reference
Plot a function curve defined as half the sum of cosine and sine. Also draw its derivative curve to show the relationship between the function and its rate of change. Include a tangent line touching the function at a point, and use rectangular bars to approximate the function's behavior near that point, illustrating the concept of derivative as a slope. Arrange the graph clearly to display the original curve, derivative curve, tangent line, and bars together, suitable for introductory calculus teaching.
The prompt above was compiled from the original drawing commands and is for reference only.