
Derivative Demonstration and Calculation
Loading the math board and drawing, please wait…
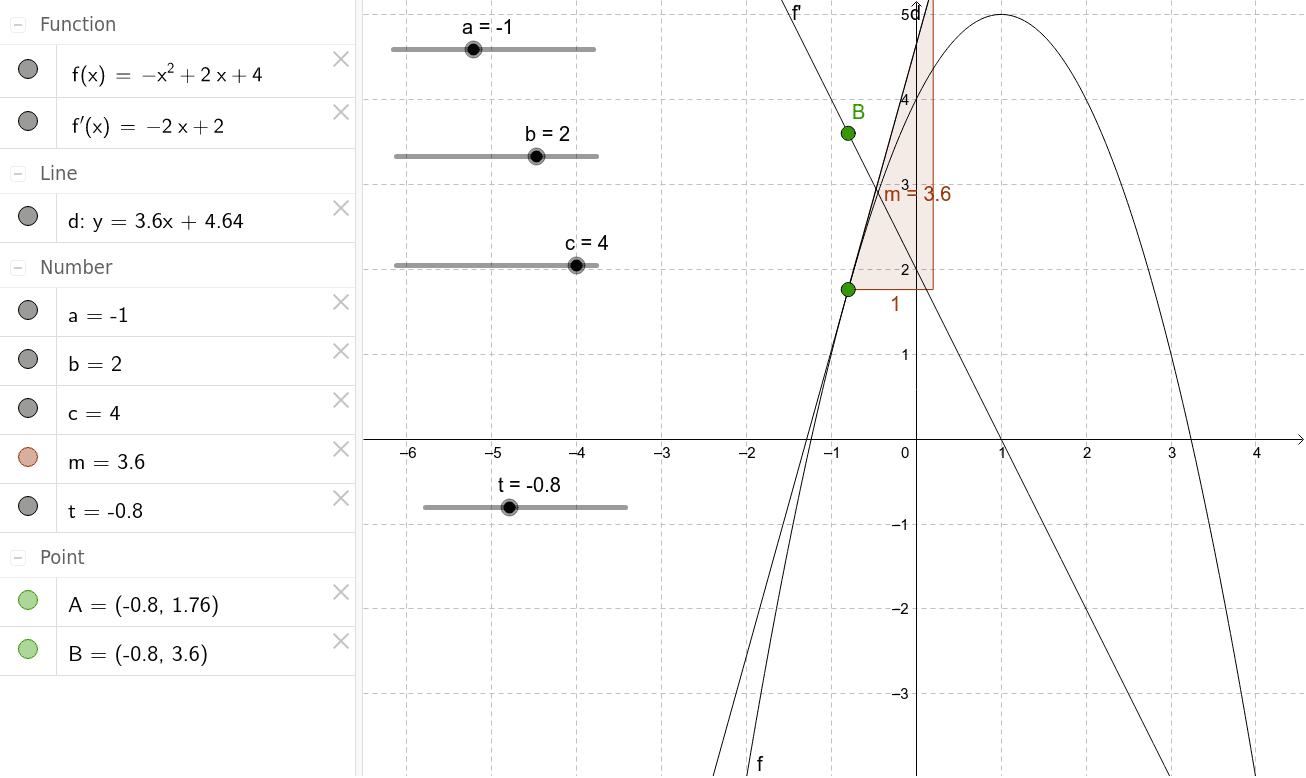
This example dynamically demonstrates the tangent and slope of a function's graph, visually showing the geometric meaning of the derivative. Core mathematical concepts include derivatives, slopes, function graphs, and tangents. Construction highlights are derived from GeoGebra commands like Tangent and Slope, involving objects such as a, b, c, f, t, A, d, m, f', B, used to build functions, tangents, and calculate slopes. Suitable for high school and above students learning calculus to understand the definition and calculation of derivatives.
GeoGebra Commands & Parameters
Tangent(A, f) → dSlope(d) → m
AI Drawing Prompt Reference
Draw a function curve with a point selected on it. Construct the tangent line to the curve at that point, and display the slope value of this tangent. The figure should include the function graph, the tangent point, the tangent line, and a slope label, illustrating the geometric meaning of the derivative. Start by plotting the function, then mark the point, draw the tangent, and finally show the calculated slope. The overall layout should clearly show the relationship among the function, tangent, and slope for teaching derivative concepts.
The prompt above was compiled from the original drawing commands and is for reference only.