
Derivative and Integral of y=x
Loading the math board and drawing, please wait…
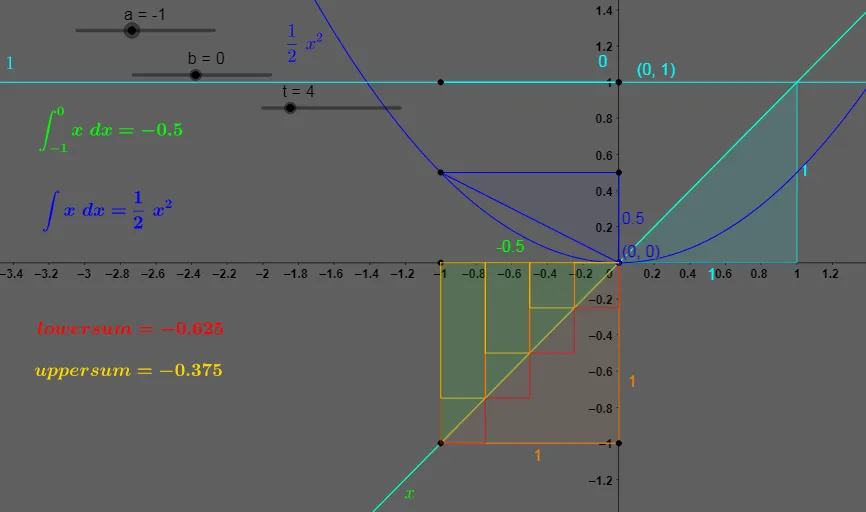
This example demonstrates the derivative and integral of the function y=x. It involves core mathematical concepts such as derivatives and integrals. Using GeoGebra commands like Integral, Derivative, and Tangent, the graph of the function, tangents, and integration areas can be constructed. Suitable for high school mathematics education and learning.
GeoGebra Commands & Parameters
Integral(f(x)) → gOrthogonalLine(A, xAxis) → hOrthogonalLine(B, xAxis) → iIntersect(g, i, 1) → CIntersect(g, h, 1) → DOrthogonalLine(D, yAxis) → jIntersect(i, j) → EPolygon(D, E, C) → t1, c, d, eLine(D, C) → kSlope(k) → m_1Integral(f(x), a, b) → lDerivative(f(x)) → f'Intersect(f', h, 1) → FIntersect(f', i, 1) → GOrthogonalLine(F, h) → nIntersect(i, n) → HPolygon(F, H, G) → t2, g_1, f_1, h_1Line(F, G) → pSlope(p) → m_3Intersect(f, i, 1) → ITangent(I, f) → qSlope(q) → m_4Intersect(f, h, 1) → JOrthogonalLine(J, h) → rIntersect(i, r) → KPolygon(J, K, I) → t3, i_1, j_1, k_1LowerSum(f(x), a, b, t) → mUpperSum(f(x), a, b, t) → s
AI Drawing Prompt Reference
Draw the graph of the function y=x. Show its derivative and integral. Plot the straight line, mark two points on the x-axis, and draw vertical lines through them. Construct a polygon bounded by these vertical lines, the x-axis, and the function curve to represent the definite integral. Then draw the derivative (a horizontal line) and form another polygon with vertical lines and the x-axis. Add a tangent line at a point on the function and display its slope. Finally, use upper and lower rectangular sums to approximate the integral area.
The prompt above was compiled from the original drawing commands and is for reference only.