
Demonstration of the Equation a+b=c
Loading the math board and drawing, please wait…
In collections
Complex Math
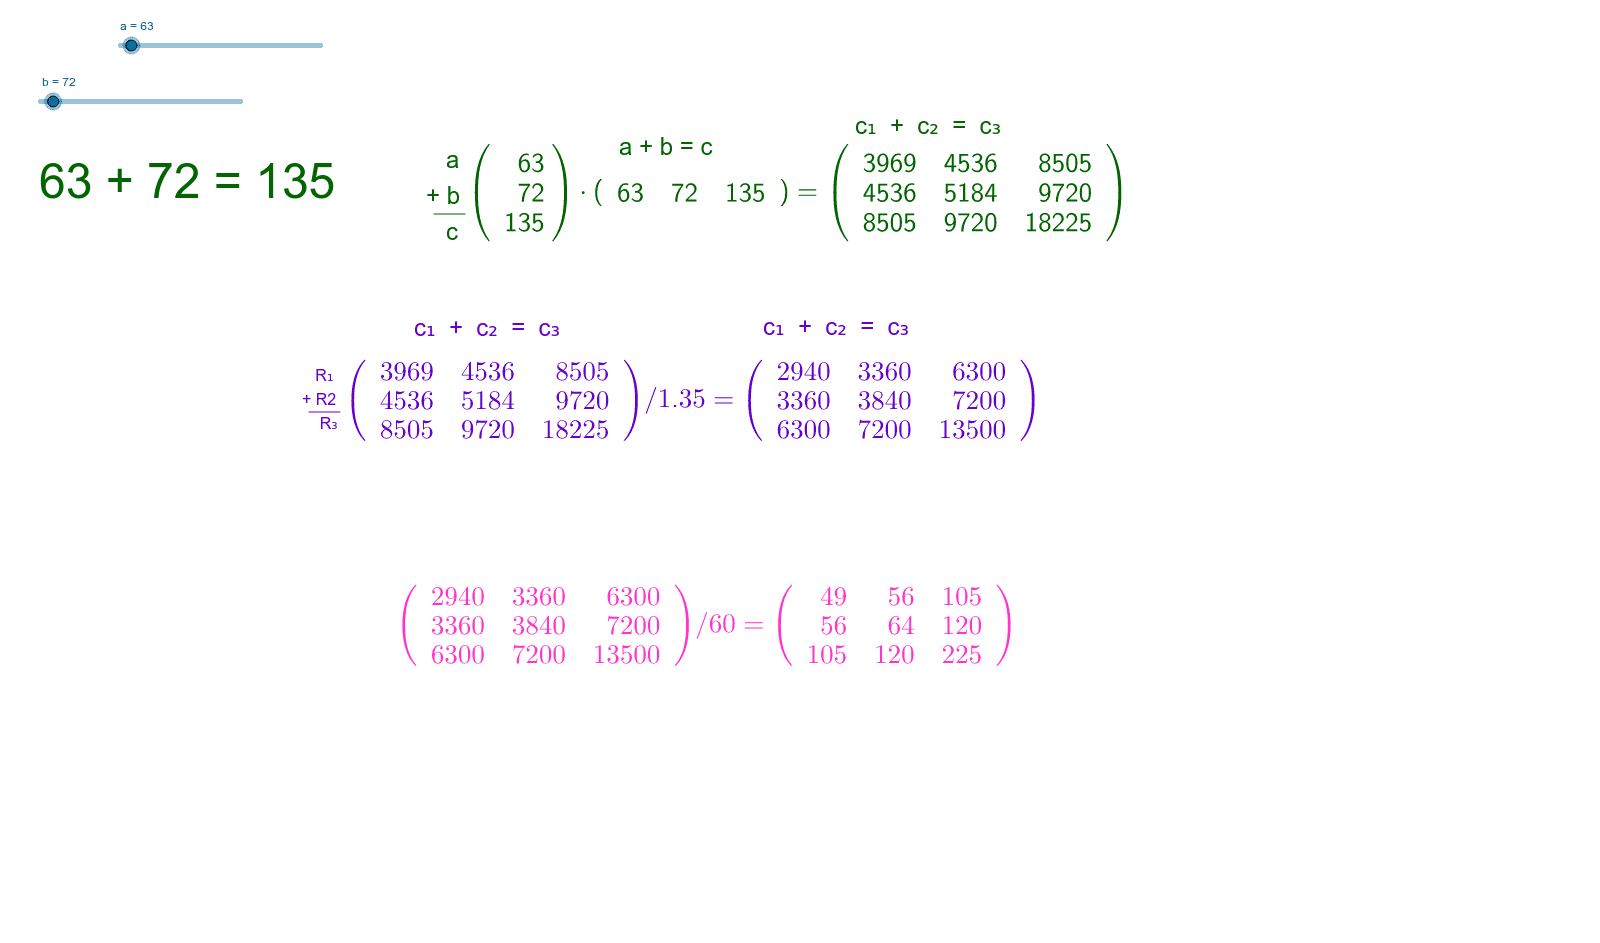
This example demonstrates the graphical outcome of the equation a+b=c. It involves basic algebraic concepts. Using GeoGebra commands such as Sum, Transpose, MatrixRank, ReducedRowEchelonForm, and Segment, the equation a+b=c can be clearly constructed. Suitable for students from middle school and above to learn algebra and geometry.
GeoGebra Commands & Parameters
Sum(A1:A2) → A3Transpose(matrix1) → matrix2MatrixRank(matrix1) → dMatrixRank(matrix2) → eMatrixRank(matrix3) → fReducedRowEchelonForm(matrix3) → matrix4MatrixRank(matrix5) → iMatrixRank(matrix8) → jMatrixRank(matrix10) → kSegment(C, D) → lSegment(C_1, D_1) → l_1
AI Drawing Prompt Reference
Draw a graph of the equation a+b=c, involving a linear combination of two variables a and b. First, create a matrix with a and b, then compute its transpose matrix, rank, and reduced row echelon form. Next, based on the ranks of these matrices, draw two segments CD and C₁D₁ to represent the relationship between the ranks.
The prompt above was compiled from the original drawing commands and is for reference only.