
Demonstration of Limits of Piecewise-Defined Function
Loading the math board and drawing, please wait…
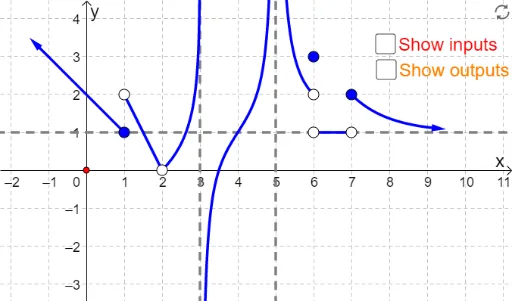
This example demonstrates the left-hand, right-hand, and normal limits of a piecewise-defined function by dragging a red dot. It involves the concept of limits and uses commands like Point, Polygon, Vector, etc. Suitable for high school mathematics education and learning.
GeoGebra Commands & Parameters
Point(xAxis) → HPolygon(K, L, M, N) → poly1, k, l, m, nVector(H, (x(H), f(x(H)))) → aVector((x(H), f(x(H))), (0, f(x(H)))) → bVector((-1, f(-1)), (-1.5, f(-1.5))) → uVector((9, f(9)), (9.5, f(9.5))) → v
AI Drawing Prompt Reference
Draw the graph of a piecewise-defined function with a draggable red point on the x-axis; from that point draw a vertical segment up to the curve and then a horizontal segment from the curve point leftward to the y-axis; also add a left-hand limit vector starting at x = -1 pointing further left, and a right-hand limit vector starting at x = 9 pointing further right, to illustrate left, right, and ordinary limits.
The prompt above was compiled from the original drawing commands and is for reference only.