
Demonstration of Increasing and Decreasing Functions
Loading the math board and drawing, please wait…
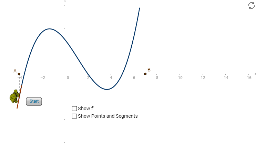
This example illustrates the 'increasing' and 'decreasing' intervals of a function, focusing on concepts like derivatives, function graphs, and monotonicity. It utilizes GeoGebra commands such as Intersect, Function, If, Tangent, UnitVector, and Segment to construct key elements like points of intersection, tangents, and segments. Suitable for high school and above, it helps students understand how derivatives determine monotonicity in calculus.
GeoGebra Commands & Parameters
Intersect(f', xAxis) → M, NFunction(f, -4, 6.5) → gIf((a > 0) ∧ (a < 1), X_1, If[(b ≥ 0) ∧ (b < 1) ∧ a ≟ 1, X_2, If[(c ≥ 0) ∧ (c < 1) ∧ b ≟ 1, X_3]]) → XTangent(C, g) → eUnitVector(e) → uSegment(X, C) → dSegment(C - u, C + u) → hSegment(M, (x(M), g(x(M)))) → kSegment(N, (x(N), g(x(N)))) → l
AI Drawing Prompt Reference
Draw a function graph and indicate its increasing and decreasing intervals. First, plot the intersections of the derivative with the x-axis. Then, draw the function itself. Use different colors or markers to highlight the increasing and decreasing intervals based on the sign of the derivative. At the points where the derivative is positive or negative, draw tangent lines to the function graph, and connect these points to the function curve with line segments. Finally, at the zeros of the derivative, draw unit vectors and line segments extending from these points in both directions.
The prompt above was compiled from the original drawing commands and is for reference only.