
Demonstrating Taylor Polynomials for Local Approximation
Loading the math board and drawing, please wait…
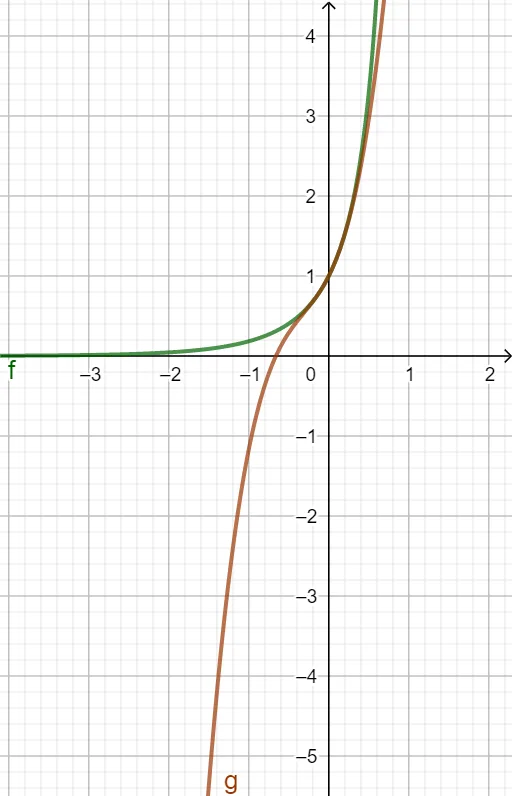
This example demonstrates how to expand a function into a Taylor polynomial to obtain a local approximation around a chosen point, highlighting how the approximation improves as the polynomial order changes. Key concepts include Taylor’s theorem, derivatives evaluated at the expansion point, and the interpretation of functions via power-series-like polynomial approximations. In GeoGebra, you define the target function as an object f (and a comparison object g if used), then construct the Taylor approximation using the command TaylorSeries. The construction relies on the GeoGebra command TaylorSeries applied to the objects f and g, typically allowing the viewer to compare the Taylor polynomial curve/expression with the original function. Suitable for upper-secondary advanced study and early university calculus instruction, especially for teaching the link between derivatives and polynomial approximations.
GeoGebra Commands & Parameters
TaylorSeries(ℯ^(x) / (1 - x), 0, 3) → g
AI Drawing Prompt Reference
Draw a graph showing the function e^x divided by (1 minus x) and its third-order Taylor polynomial centered at x equals 0. Plot both curves on the same coordinate system, with the original function as one curve and the Taylor approximation as another. The Taylor polynomial should closely match the original function near the expansion point, but diverge further away. Construct the original function first, then overlay the Taylor polynomial curve to illustrate local approximation.
The prompt above was compiled from the original drawing commands and is for reference only.