
Demonstrating Real Roots of a Parabola
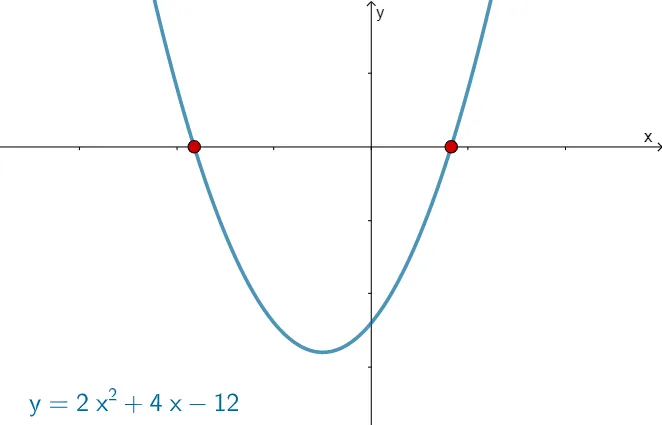
Loading the math board and drawing, please wait…
In collections
FOM 12 BC
This example illustrates how the real roots of a quadratic function change with variations in its parameters. Key math concepts include quadratic functions, discriminants, real roots, and function graph transformations. It is constructed using GeoGebra commands like RandomElement, Random, If, Extremum, Max, Min, Root, and Textfield to dynamically visualize the function's graph and root positions. Suitable for high school mathematics education to explore the impact of parameter changes on quadratic function properties.
GeoGebra Commands & Parameters
RandomElement({-2, -1, -1, 1, 1, 1, 1, 2, 3, 5}) → aRandom(0, 15) → kposRandom(-15, 0) → knegRandom(-5, 8) → hIf(a ≥ 0, Expand[(a * (x - h)^(2)) + kneg], Expand[(a * (x - h)^(2)) + kpos]) → fExtremum(f) → VMax(y(V) + 5, 10) → ymaxMin(y(V) - 5, -8) → yminRoot(f) → B, CTextfield(emptyleft) → InputBox1Textfield(emptyright) → InputBox2Min(x(B) - 4, -6) → xminMax(x(C) + 4, 6) → xmax
AI Drawing Prompt Reference
Draw a parabola with a vertex and x-intercepts, where the vertex position and opening direction vary randomly, x-intercepts are clearly marked, and include text boxes showing parameter ranges, with coordinate axes and grid lines for reference, creating a clear and visually appealing layout suitable for educational purposes.
The prompt above was compiled from the original drawing commands and is for reference only.