
Demonstrating Parabola Differences
Loading the math board and drawing, please wait…
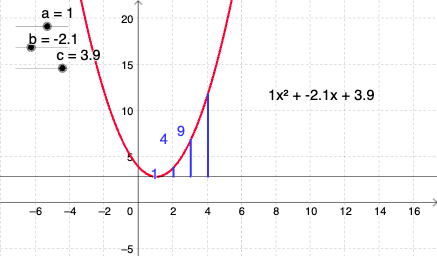
This example demonstrates the variations in parabola shapes under parameter changes. It involves core mathematical concepts such as parabolas, dilation, frequency distribution, secant lines, and fractal geometry. The construction uses GeoGebra commands like Segment and Distance, with objects including parameters a, b, c, f, points A, B, C, D, E, F, G, g, d, e, h, i, j, k, l, m, n, o, and text1. It is suitable for high school and above students to understand parabolic transformations and geometric properties.
GeoGebra Commands & Parameters
Segment(B, E) → eSegment(C, F) → hSegment(D, G) → iDistance(h, e) → jDistance(e, i) → kDistance(i, e) → lDistance(h, e) → mDistance(h, e) → nDistance(h, e) → o
AI Drawing Prompt Reference
Draw a diagram showing variations in parabola shapes, including three line segments with their distances measured and labeled, to illustrate how these distances change with parameters and reveal geometric transformation properties of parabolas.
The prompt above was compiled from the original drawing commands and is for reference only.