
Correlation Analysis and Regression Line
Loading the math board and drawing, please wait…
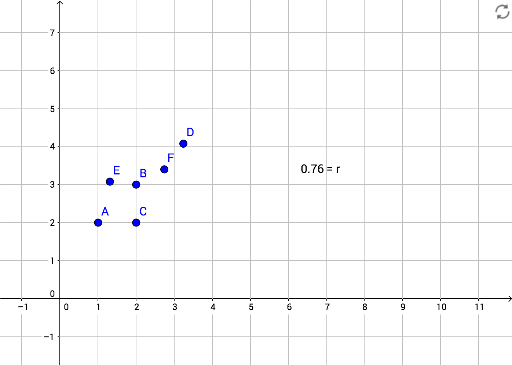
This example demonstrates how to calculate the Pearson correlation coefficient and fit a regression line to data points using GeoGebra. It involves core mathematical concepts such as correlation, linear regression, scatter plots, and statistical characteristics. The construction uses the FitLineY and PMCC commands with objects A, B, C, D, E, F, f, a, and text1 to compute and display results. It is suitable for high school and early college students studying statistics and data analysis.
GeoGebra Commands & Parameters
FitLineY({A, B, C, D, E, F}) → fPMCC({A, B, C, D, E, F}) → a