
Demonstrating Complex Points on a Parabola
Loading the math board and drawing, please wait…
In collections
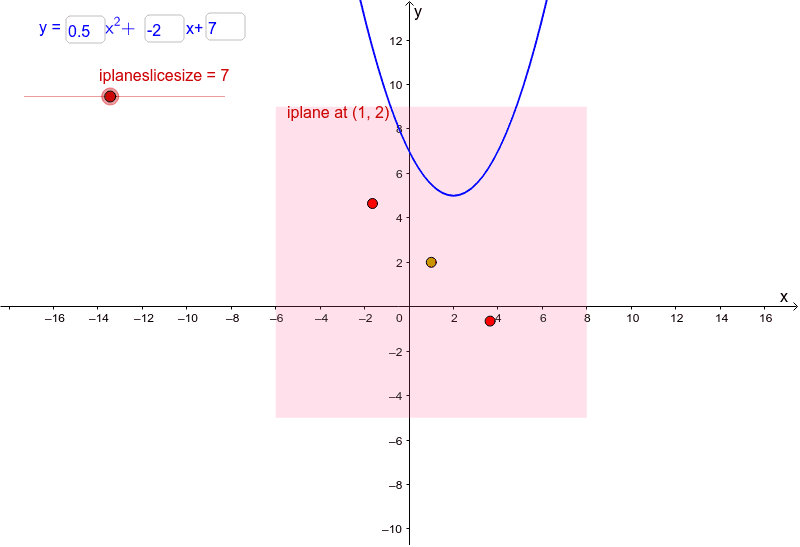
Complex points using iplanes
This example illustrates the distribution and properties of complex points on a parabola. It involves core mathematical concepts such as complex numbers, parabolas, linear functions, and coordinate geometry. The construction utilizes GeoGebra commands like Polygon, Textfield, points C, a, b, c, iplaneslicesize, iplaneslice, Q, and variables like sx, thing, d, R, A, B. It is suitable for high school students and above, particularly for understanding the application of complex numbers in coordinate geometry, as well as for mathematical competitions and teaching demonstrations.
GeoGebra Commands & Parameters
Polygon(C + (iplaneslicesize * {(1, 1), (-1, 1), (-1, -1), (1, -1)})) → iplanesliceTextfield(a) → InputBox1Textfield(b) → InputBox2Textfield(c) → InputBox3
AI Drawing Prompt Reference
Draw a parabola with its vertex at the origin and mark three complex points C, a, b, and c on it. Surround these four points with a square whose size is adjusted by the slider iplaneslicesize. Use input boxes InputBox1, InputBox2, and InputBox3 to input the real and imaginary parts of the complex points.
The prompt above was compiled from the original drawing commands and is for reference only.