
Demo: Plotting in a New Tab—Interactive Graphs and Geometry
Loading the math board and drawing, please wait…
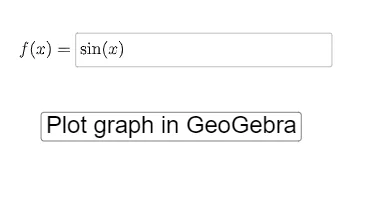
This example demonstrates how to plot and display a mathematical construction or function graph in GeoGebra in a new browser tab using an interactive UI control. The core math ideas involve function graphing as well as classical geometry topics such as equilateral and isosceles triangle configurations and related circle concepts (e.g., circumcircle / inscribed or circumscribed circle constructions). The construction relies on GeoGebra interface objects: a Textfield, an interactive button (button1), a function object f, and an input field (InputBox1) to capture user-entered expressions or parameters. When the user triggers the button, the app generates the corresponding plot and opens it in the new tab for focused viewing. Suitable for secondary-school teaching demos, classroom interactive activities, and learners practicing how parameters and controls drive graph/geometry visualization.
GeoGebra Commands & Parameters
Textfield(f) → InputBox1
AI Drawing Prompt Reference
Create an interactive demo interface that visualizes a mathematical function graph alongside classical geometry about circles tied to equilateral and isosceles triangle configurations. Include an input area where a user can type an expression or parameters, and a button that triggers the drawing. After the user submits, render the corresponding function curve and display the key circle relationships suggested by the triangle setups, such as the circumcircle of the triangle and related inscribed or circumscribed circle construction ideas. Make it parameter-driven for classroom teaching and practice.
The prompt above was compiled from the original drawing commands and is for reference only.