
Definite Integral Using Substitution with Dynamic Area Visualization
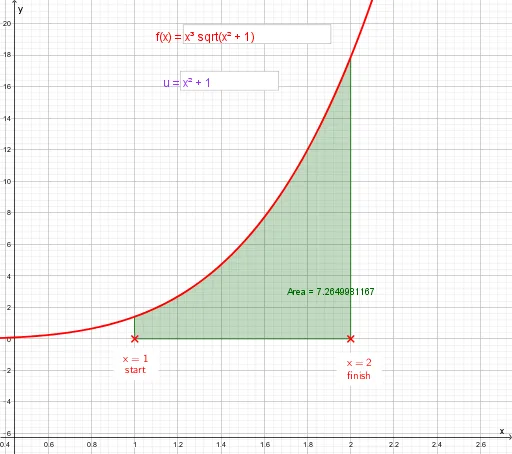
Loading the math board and drawing, please wait…
This GeoGebra example demonstrates the method of substitution (u-substitution) for definite integrals through an interactive visualization. It shows how changing the integration variable from u to x transforms the integrand, the limits of integration, and the corresponding area under the curve. Core mathematical concepts include the geometric interpretation of definite integrals as signed areas, the substitution formula ∫f(u)du = ∫f(g(x))g'(x)dx, and the transformation of integration bounds. The construction uses Point objects to define key coordinates, IntegralBetween to compute the area between curves, Invert for inverse transformations, and Textfield/InputBox for user input. Dynamic objects Δx and ΔI illustrate infinitesimal changes, while the AREA object updates the computed area in real time. This resource is ideal for high school seniors or early university students learning calculus, helping them grasp why substitution preserves the integral value and how the integration region changes under variable transformation.
GeoGebra Commands & Parameters
Point(xAxis) → APoint(xAxis) → BIntegralBetween(f, 0, a, b) → AreaInvert(u) → IIntegralBetween(g, 0, c, d) → AREATextfield(f) → InputBox1Textfield(u) → InputBox2