
Polar Curve Parametric Trajectory Example
Loading the math board and drawing, please wait…
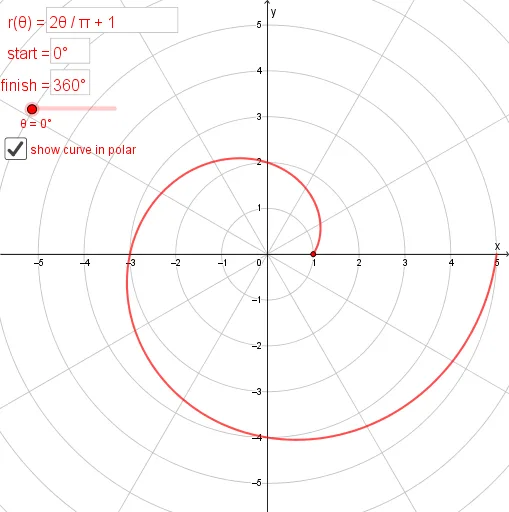
This GeoGebra example demonstrates the dynamic generation of polar curve trajectories by varying the parameter θ, illustrating how polar equations produce common shapes such as circles, cardioids, and spirals. Core mathematical concepts include polar coordinate systems, parametric equations, locus generation, and the relationship with the unit circle. Construction highlights involve the use of GeoGebra commands Locus, Textfield, InputBox, and showPolarCurve, with key objects θ, r, P, Q, and Δθ controlling the curve's behavior. The example is suitable for high school pre-calculus, calculus introduction, or mathematics education focused on parametric and polar functions, helping learners visualize curve formation and parameter effects interactively.
GeoGebra Commands & Parameters
Locus(P, θ) → loc1Locus(Q, θ) → loc2Textfield(r) → InputBox1Textfield(a) → InputBox2Textfield(b) → InputBox3