
Decimals and Place Value
Loading the math board and drawing, please wait…
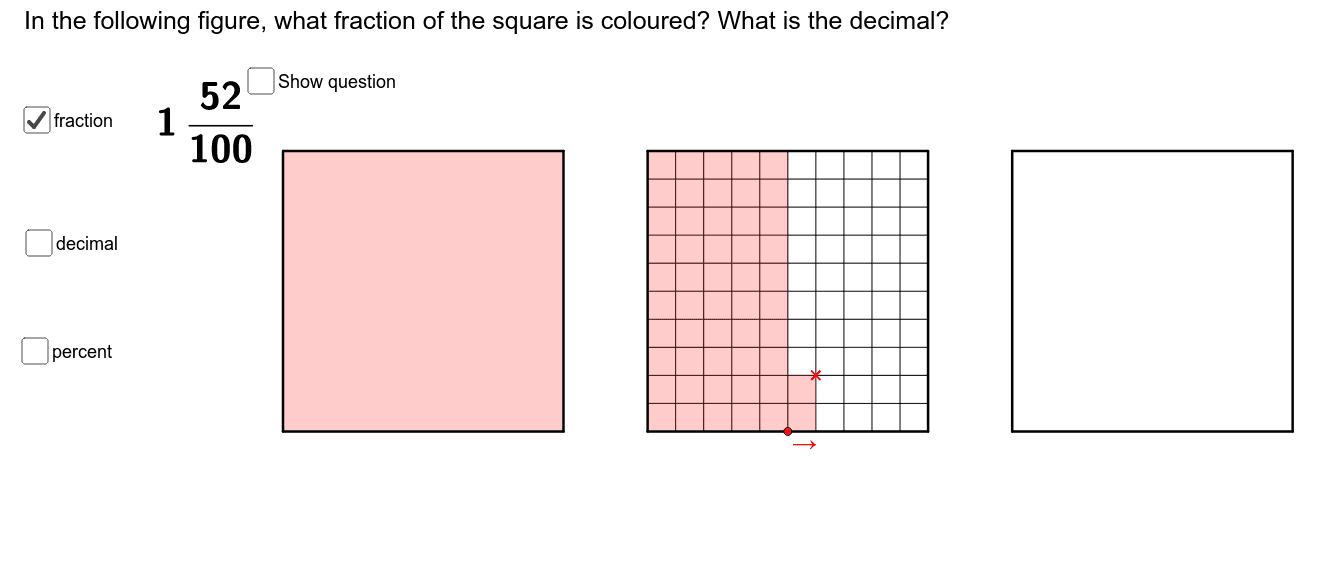
This example dynamically demonstrates the relationship between decimals and place value, visually showing the significance of each decimal place. Core math concepts include decimal representation, place value, and the decimal system. GeoGebra commands like Corner, Point, Polygon, If, and Sequence are used to construct a decimal model with dynamic features. Suitable for middle school and above, helping students grasp the connection between decimals and integers.
GeoGebra Commands & Parameters
Corner(5) → A_1Point(Sequence[(k, 0), k, 0, 3.6, 0.1]) → APoint(Sequence[(x(A) + 0.1, j), j, 0, 1, 0.1]) → BPolygon((1.3, 0), (2.3, 0), (2.3, 1), (1.3, 1)) → poly3, i, j, k, lPolygon((2.6, 0), (3.6, 0), (3.6, 1), (2.6, 1)) → poly4, m, n, p_1, qIf((x(A) ≥ 1) ∧ (x(A) < x(Vertex[poly3, 1])) ∨ (x(A) ≥ x(Vertex[poly3, 2])) ∧ (x(A) < x(Vertex[poly4, 1])) ∨ x(A) ≟ x(Vertex[poly4, 2]), true, false) → integerPolygon(A, A + (0.1, 0), A + (0.1, If[integer, 0, y(B)]), A + (0, If[integer, 0, y(B)])) → poly8, j_1, k_1, l_1, m_1Polygon((0, 0), (Min[x(A), 1], 0), (Min[x(A), 1], 1), (0, 1)) → poly5, r, s, t, a_1Polygon((x(Vertex[poly3, 1]), 0), (Max[Min[x(A), x(Vertex[poly3, 1]) + 1], x(Vertex[poly3, 1])], 0), (Max[Min[x(A), x(Vertex[poly3, 1]) + 1], x(Vertex[poly3, 1])], 1), (x(Vertex[poly3, 1]), 1)) → poly6, b_1, c_1, d_1, e_1Polygon((x(Vertex[poly4, 1]), 0), (Max[Min[x(A), x(Vertex[poly4, 1]) + 1], x(Vertex[poly4, 1])], 0), (Max[Min[x(A), x(Vertex[poly4, 1]) + 1], x(Vertex[poly4, 1])], 1), (x(Vertex[poly4, 1]), 1)) → poly7, f_1, g_1, h_1, i_1Polygon((0.8187524918794742, 1.1041021645196354), (1.818752491879475, 1.1041021645196354), (1.818752491879475, 2.1041021645196336), (0.8187524918794742, 2.1041021645196336)) → poly1, a, b, c, dPolygon((0, 0), (1, 0), (1, 1), (0, 1)) → poly2, e, f, g, hIf(y(B) < 1, (100 * poly8), 0) → hundredthdigitSequence(Segment[(i, 0), (i, 1)], i, 0, 1, p) → list1Sequence(Segment[(x(Vertex[poly3, 1]) + i, 0), (x(Vertex[poly3, 1]) + i, 1)], i, 0, 1, p) → list2Sequence(Segment[(x(Vertex[poly4, 1]) + i, 0), (x(Vertex[poly4, 1]) + i, 1)], i, 0, 1, p) → list3Sequence(Segment[(0, j), (1, j)], j, 0, 1, p) → list4Sequence(Segment[(x(Vertex[poly3, 1]), j), (x(Vertex[poly3, 1]) + 1, j)], j, 0, 1, p) → list5Sequence(Segment[(x(Vertex[poly4, 1]), j), (x(Vertex[poly4, 1]) + 1, j)], j, 0, 1, p) → list6
AI Drawing Prompt Reference
Create a dynamic visual model showing the relationship between decimals and place value. Draw a horizontal number line from 0 to 3.6 with tick marks every 0.1. Place two rectangular blocks: one from x=1.3 to 2.3 and another from x=2.6 to 3.6, both with height 1, representing the integer and decimal parts. Add a movable vertical strip of width 0.1 that highlights the current decimal position. Use colored polygons to fill the integer part, the tenths, and the hundredths regions based on the strip's location. Overlay grid lines within each unit to subdivide into tenths and hundredths, making the value of each decimal place visually clear.
The prompt above was compiled from the original drawing commands and is for reference only.