
Decimal Number Line
Loading the math board and drawing, please wait…
In collections
Mathematics Form 1
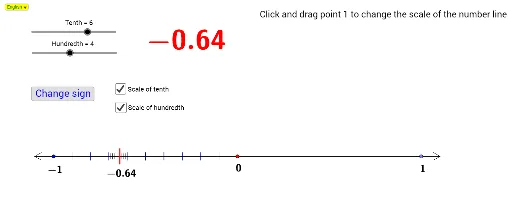
This example demonstrates the concept of a decimal number line, illustrating the representation and positioning of decimals. Using GeoGebra commands such as Line, Point, and Segment, it provides a visual understanding of decimals on a number line. Suitable for upper elementary and middle school students to learn about decimals and number lines.
GeoGebra Commands & Parameters
Line(A, xAxis) → aPoint(a) → BRay(A, B) → ePoint(e) → CCircle(A, C) → dIntersect(d, a, 1) → DSegment(D, C) → fDistance(A, C) → ACIf(Ms ≟ "", Sequence[(p, y(A) + 0.2), p, x(A) + OneDiv10, x(A) + AC - OneDiv10, OneDiv10], Sequence[(q, y(A) + 0.2), q, x(A) - OneDiv10, x(A) - AC + OneDiv10, 0 - OneDiv10]) → ListTopIf(Ms ≟ "", Sequence[(p, y(A) - 0.2), p, x(A) + OneDiv10, x(A) + AC - OneDiv10, OneDiv10], Sequence[(q, y(A) - 0.2), q, x(A) - OneDiv10, x(A) - AC + OneDiv10, 0 - OneDiv10]) → ListBottomZip(Segment[p, q], p, ListTop, q, ListBottom) → ScaleSegIf(Ms ≟ "", (x(A) + (b * OneDiv10) + (c * OneDiv100), y(A)), (x(A) - (b * OneDiv10) - (c * OneDiv100), y(A))) → EIf(Ms ≟ "", Sequence[(p, y(A) - 0.15), p, x(A) + (b * OneDiv10) + OneDiv100, x(A) + ((b + 1) * OneDiv10) - OneDiv100, OneDiv100], Sequence[(q, y(A) - 0.15), q, x(A) - (b * OneDiv10) - OneDiv100, x(A) - ((b + 1) * OneDiv10) + OneDiv100, 0 - OneDiv100]) → ListBottomSIf(Ms ≟ "", Sequence[(p, y(A) + 0.15), p, x(A) + (b * OneDiv10) + OneDiv100, x(A) + ((b + 1) * OneDiv10) - OneDiv100, OneDiv100], Sequence[(q, y(A) + 0.15), q, x(A) - (b * OneDiv10) - OneDiv100, x(A) - ((b + 1) * OneDiv10) + OneDiv100, 0 - OneDiv100]) → ListTopSZip(Segment[p, q], p, ListTopS, q, ListBottomS) → ScaleSegSSegment((x(E), y(E) + 0.4), (x(E), y(E) - 0.4)) → gCircle(C, 1) → kIntersect(k, a, 2) → FCircle(F, 0.4) → pIntersect(p, a, 1) → GRotate(G, 30°, F) → G'Rotate(G, (-(30°)), F) → G'_1Segment(F, G'_1) → jSegment(F, G') → lSegment(C, F) → mCircle(D, 1) → qIntersect(q, a, 1) → HCircle(H, 0.4) → rIntersect(r, a, 2) → IRotate(I, 30°, H) → I'Rotate(I, (-(30°)), H) → I'_1Segment(I'_1, H) → nSegment(H, I') → sSegment(H, D) → tSelectedIndex(Bahasa) → nnIf(nn ≟ 1, "Click and drag point 1 to change the scale of the number line", "Klik dan seret titik 1 untuk menukar skala garis nombor") → text6