
Decimal in Three Forms (Modified Copy)
Loading the math board and drawing, please wait…
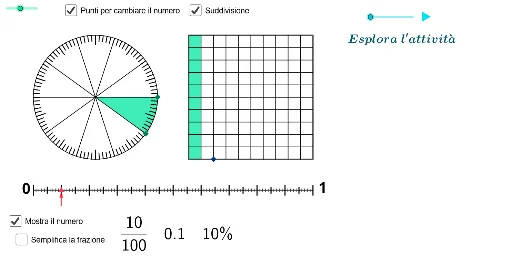
① This interactive GeoGebra example demonstrates how a single decimal value can be represented in three equivalent forms: decimal, fraction, and percentage, using a visual sector model. ② Core mathematical concepts include equivalence among decimals, fractions, and percentages, and part-whole relationships. ③ Construction highlights: uses commands such as Circle, Sector, Polygon to create the visual model; Sequence, Zip, RandomElement for generating random values and dynamic updates; TableText to display a comparison table; and sliders or buttons for interactive control. ④ Suitable for upper elementary to middle school students learning conversions between fractions, decimals, and percentages, and for teachers creating dynamic lesson materials.
GeoGebra Commands & Parameters
Circle((0, 0), 1) → cSequence(Point[{cos(((i * 2) * π / 10)), sin(((i * 2) * π / 10))}], i, 0, 9) → list1Zip(Segment[(0, 0), A], A, list1) → list2Sequence(Point[{cos(((i * 2) * π / 100)), sin(((i * 2) * π / 100))}], i, 0, 99) → list3Sequence(Point[{(0.9 * cos(((i * 2) * π / 100))), (0.9 * sin(((i * 2) * π / 100)))}], i, 0, 99) → list4Zip(Segment[A, B], A, list3, B, list4) → list5Point(list3) → APoint(list3) → BSector(c, A, B) → dSequence(Point[{cos(((i * 2) * π / 10) + π / 10), sin(((i * 2) * π / 10) + π / 10)}], i, 0, 9) → list6Zip(Segment[A, (0.85 * A)], A, list6) → list7Polygon((1.5, -1), (3.5, -1), 4) → squareOutlineRemove(Flatten[Sequence[Sequence[Point[{i, j}], j, -1, 1, 0.2], i, 1.7, 3.5, 0.2]], {(3.5, 1)}) → squarePointsMod(100 - (IndexOf[A, list3] - IndexOf[B, list3]), 100) → circleSizePoint(squarePoints) → CVertex(squareOutline) → D, E, F, GSegment(G, F) → fSegment(F, E) → gSegment(E, D) → hSegment(D, G) → iOrthogonalLine(C, f) → jOrthogonalLine(C, g) → kIntersect(j, f) → HIntersect(k, i) → IIntersect(j, h) → JOrthogonalLine(K, k) → lIntersect(k, l) → LFlatten(Sequence[Sequence[Point[{i, j}], j, -1, 0.8, 0.2], i, 1.7, 3.5, 0.2]) → backupSquarePointsIntersect(l, h) → MPolygon(D, G, K, L, C, J) → poly1, d_1, g_1, k_1, l_1, c_1, j_1Sequence(Point[{i, -1.5}], i, -1, 3.5 - 0.045, 0.045) → linePointsPoint(linePoints) → NSegment((-1, -1.5), (3.5, -1.5)) → mSequence(Segment[(i, -1.525), (i, -1.475)], i, -1, 3.5, 0.045) → L_2Vector(N - (0, 0.25), N) → uSequence(Segment[(i, -1.55), (i, -1.45)], i, -1 + 0.45 / 2, 3.5, 0.45) → L_3Sequence(Segment[(i, -1.58), (i, -1.42)], i, -1, 3.5, 0.45) → L_1Sequence(Segment[(1.5, j), (3.5, j)], j, -0.8, 0.8, 0.2) → L_4Sequence(Segment[(i, -1), (i, 1)], i, 1.7, 3.3, 0.2) → L_5TableText({If[n, FractionText[circleSize / 100], (((("\frac{" * circleSize) * "}{") * 100) * "}")], circleSize / 100, circleSize + "%"}) → text3Random(0, 99) → numIf(num / 100 ≟ circleSize / 100, 1, 0) → verRandomElement(sce) → sce'If(es ≟ 3, "punti", "punto") → puntIf(es ≟ 2, -1.45, If[es ≟ 3, 1.5, 0.1]) → c'Random(1, 6) → imIf(es ≟ 3, "i", "il") → art
AI Drawing Prompt Reference
Draw a circle with a sector inside representing a percentage value. Outside the circle, display the corresponding fraction and decimal value of the percentage. Include a square outside the circle with points and lines dynamically showing the decimal representation. The diagram should feature interactive sliders to adjust the sector size and value display, with a table comparing different representations.
The prompt above was compiled from the original drawing commands and is for reference only.