
Curve Fitting and Derivative Analysis of Finland's Outline
Loading the math board and drawing, please wait…
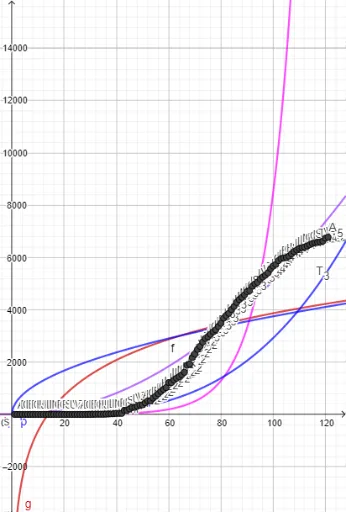
This GeoGebra example uses the outline of Finland as a visual context to demonstrate how to approximate a set of discrete points with various function-fitting models and then analyze the derivative properties of the fitted curves. Core mathematical concepts include function fitting (logarithmic, exponential, power, logistic, and general fit), piecewise polyline construction, and the application of derivatives to understand shape changes. Construction highlights: the PolyLine command connects 20 key points (A1 to B20) to form the base contour, while commands like FitLog, FitExp, FitPow, Fit, and FitLogistic are used to generate different candidate curves, allowing comparison of their accuracy and smoothness. The derivative tool can be applied to study increasing/decreasing intervals and curvature. Suitable for high school to undergraduate mathematics, this example supports lessons on data fitting, model selection, and the geometric meaning of derivatives, and also serves as an interdisciplinary project linking geography and mathematics.
GeoGebra Commands & Parameters
PolyLine(l1) → fFitLog(l1) → gFitExp(l1) → hFitPow(l1) → pFit(l1, {x^(2)}) → qFit(l1, {x^(1 / 2)}) → rFitLogistic(l1) → s