
Cumulative Curve
Loading the math board and drawing, please wait…
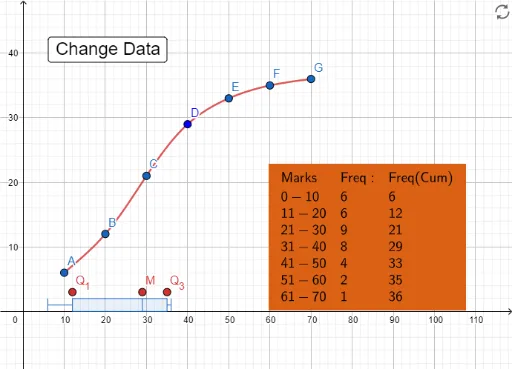
This example demonstrates the process of drawing a cumulative curve. It involves the core mathematical concept of cumulative distribution function in probability and statistics. Using GeoGebra commands such as Random, Spline, and BoxPlot, a cumulative curve can be constructed. Suitable for high school and above students to learn about probability and statistics.
GeoGebra Commands & Parameters
Random(1, 6) → sSpline({A, B, C, D, E, F, G}, 3) → aBoxPlot(1, 1, l1) → iMedian(l1) → jQ1(l1) → q_{1}Q3(l1) → q_{3}TableText({"Marks", "Freq:", "Freq(Cum)"}, {"0-10", b, b}, {"11-20", c, y(B)}, {"21-30", d, y(C)}, {"31-40", e, y(D)}, {"41-50", f, y(E)}, {"51-60", g, y(F)}, {"61-70", h, y(G)}) → text1