
Cubic Vertical Slide: Exploring Zero Counts
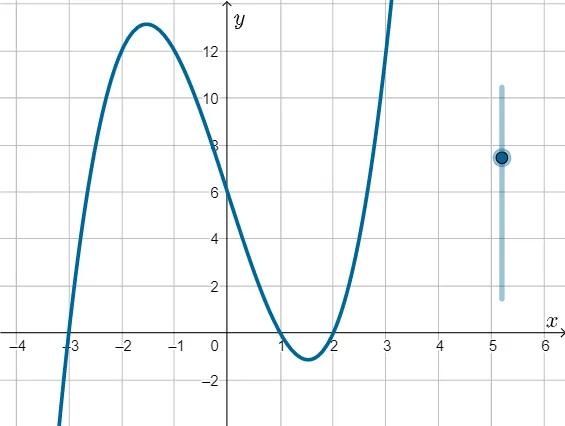
Loading the math board and drawing, please wait…
In collections
Grade 12 PreCalculus BC
①This example uses a vertical slider to dynamically adjust parameters of a cubic function, visually demonstrating how the number of real zeros changes with parameter variation. ②Core mathematical concepts include the zero distribution of cubic functions, the number of intersections between the graph and the x-axis, and polynomial expansion/simplification. ③Construction highlights: GeoGebra commands Simplify and Expand are used to manipulate expressions; objects g, a, f, h, and text1 are created, with slider a controlling the parameter, and functions f and h representing different forms of the cubic, allowing dynamic observation of zero count changes. ④Suitable for high school or early college students studying polynomial functions, graphing, and the relationship between equations and roots, as well as for exploratory math labs on how parameters affect zeros.
GeoGebra Commands & Parameters
Simplify(g(x) + a) → fExpand(g) → h
AI Drawing Prompt Reference
Draw a dynamically adjustable cubic function graph where a vertical slider changes parameters, showing how the number of real zeros changes. Use both simplified and expanded forms of the function to illustrate the zero distribution and intersection count with the x-axis.
The prompt above was compiled from the original drawing commands and is for reference only.