
Cross Sectional Solids Visualization
Loading the math board and drawing, please wait…
In collections
Calculus Concepts
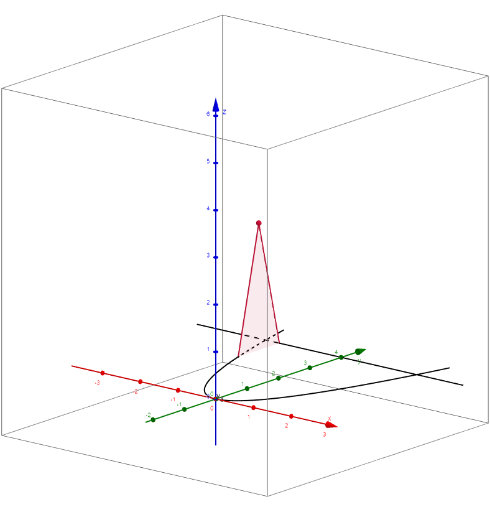
This example visualizes solids generated by cross sections protruding from the Cartesian plane. It involves core math concepts like integral calculus, volume calculation, and geometric shape construction. Key GeoGebra commands used include If, Midpoint, Polygon, CircumcircleArc, Segment, ImplicitCurve, Integral, along with sliders and input boxes to adjust cross-sectional shapes (e.g., squares, equilateral triangles, semicircles) and observe the resulting solids. Suitable for high school and above students to understand volume integrals in solid geometry and calculus.
GeoGebra Commands & Parameters
If(PerpXAxis, y_2Point, x_2Point) → Relation_2PointIf(PerpXAxis, y_1Point, x_1Point) → Relation_1PointMidpoint(Relation_1Point, Relation_2Point) → RelationMidpointIf(PerpXAxis, abs(y(Relation_2Point) - y(Relation_1Point)), abs(x(Relation_2Point) - x(Relation_1Point))) → ShapeBaseWidthTextfield(y_1) → y_1InputBoxTextfield(y_2) → y_2InputBoxPolygon(Relation_1Point, Relation_2Point, EquilateralTriangleTopPoint) → TheEquilateralTriangle, equilateraltriangleside1, equilateraltriangleside2, equilateraltriangleside3Polygon(Relation_1Point, Relation_2Point, SquareRelation_2TopPoint, SquareRelation_1TopPoint) → TheSquare, SquareBottomSide, SquareUpperSide, SquareTopSide, SquareLowerSideCircumcircleArc(Relation_1Point, SemiCircleTopPoint, Relation_2Point) → TheSemiCircleArcSegment(Relation_1Point, Relation_2Point) → TheSemiCircleBaseIf(PerpXAxis, RectangleHeightX, RectangleHeightY) → RectangleHeightPolygon(Relation_1Point, Relation_2Point, RectangleRelation_2TopPoint, RectangleRelation_1TopPoint) → TheRectangle, rectangleside3, rectangleside4, rectangleside2, rectangleside1If(PerpXAxis, IsoscelesTriangleHeightX, IsoscelesTriangleHeightY) → IsoscelesTriangleHeightPolygon(Relation_1Point, Relation_2Point, IsoscelesTriangleTopPoint) → TheIsoscelesTriangle, isoscelestriangleside1, isoscelestriangleside2, isoscelestriangleside3If(PerpXAxis, abs(y_2(x) - y_1(x)), abs(g(x) - f(x))) → ShapeBaseFormulaIf(Squares, ShapeBaseFormula(x)^(2), If[EquilateralTriangles, (sqrt(3) / 4 * ShapeBaseFormula(x)^(2)), If[SemiCircles, ((0.5 * π) * (ShapeBaseFormula(x) / 2)^(2)), If[Rectangles, (RectangleHeight(x) * ShapeBaseFormula(x)), If[IsoscelesTriangles, ((1 / 2 * ShapeBaseFormula(x)) * IsoscelesTriangleHeight(x))]]]]) → ShapeAreaFormulaTextfield(x_1InputText) → x_1InputBoxTextfield(x_2InputText) → x_2InputBoxTextfield(RectangleHeightYInputText) → RectangleHeightInputBoxPerpYAxisTextfield(TriangleHeightYInputText) → IsoscelesTriangleHeightInputBoxPerpYAxisImplicitCurve((-x) + f(y)) → x_1ImplicitCurve((-x) + g(y)) → x_2If(PerpXAxis, LowerXBound, LowerYBound) → LowerBoundIntegral(ShapeAreaFormula, LowerBound, ShapeSlider) → ShapeVolumeTextfield(UpperXBound) → UpperXBoundInputBoxTextfield(LowerXBound) → LowerXBoundInputBoxIf(PerpXAxis, UpperXBound, UpperYBound) → UpperBoundTextfield(LowerYBound) → LowerYBoundInputBoxTextfield(UpperYBound) → UpperYBoundInputBoxTextfield(RectangleHeightX) → inputBox1Textfield(IsoscelesTriangleHeightX) → inputBox2
AI Drawing Prompt Reference
Draw a 3D solid generated by cross-sectional shapes (equilateral triangles, squares, semicircles, rectangles, isosceles triangles) protruding from the Cartesian plane. The cross-sectional shapes are adjustable via input boxes. The endpoints of the cross-sections are defined by lines, and the midpoint is used to determine the center. The area of each cross-section is calculated using a formula that depends on the shape, and the volume is computed via integration. The solid includes implicit curves defining the x-coordinates and input boxes for setting the cross-section parameters.
The prompt above was compiled from the original drawing commands and is for reference only.