
Creating Double Number Line Diagrams
Loading the math board and drawing, please wait…
In collections
Unit 2 Homework: Intro to Ratios
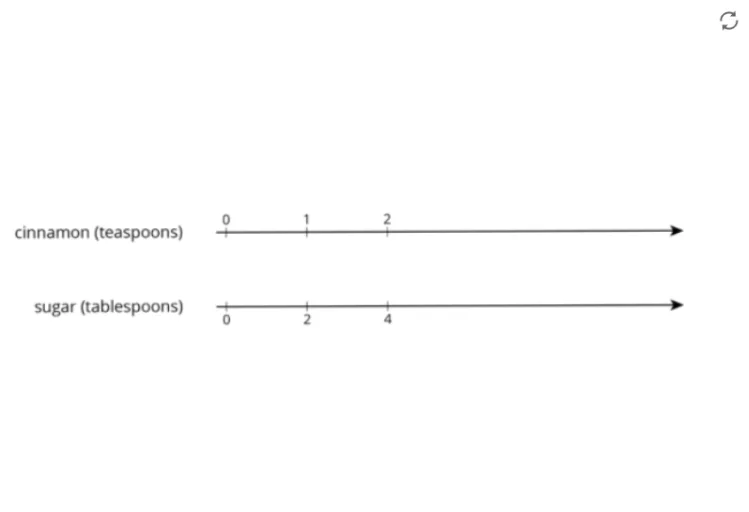
This example demonstrates how to create double number line diagrams to represent quantity changes. The key mathematical concepts include number lines, ratios, and graphical representation. The construction involves using GeoGebra commands to create objects A and B and draw pic1. It is suitable for middle or high school mathematics learning to understand the connection between numbers and shapes.
GeoGebra Commands & Parameters
Point A(-12.212067418831584, 1.649608142374871)Point B(5.124773525612726, 1.718314249156024)
AI Drawing Prompt Reference
Draw a double number line diagram showing proportional changes between two quantities. Place two points on the horizontal axis, one near the left and the other near the right, at roughly the same vertical level. Connect these two points with a smooth curve or straight segment to illustrate the relationship between the corresponding values. Keep the diagram clean, emphasizing the positions of the points and the axis scale, suitable for middle school math lessons on ratios and graphical representation.
The prompt above was compiled from the original drawing commands and is for reference only.