
Creating a Normal Distribution Model
Loading the math board and drawing, please wait…
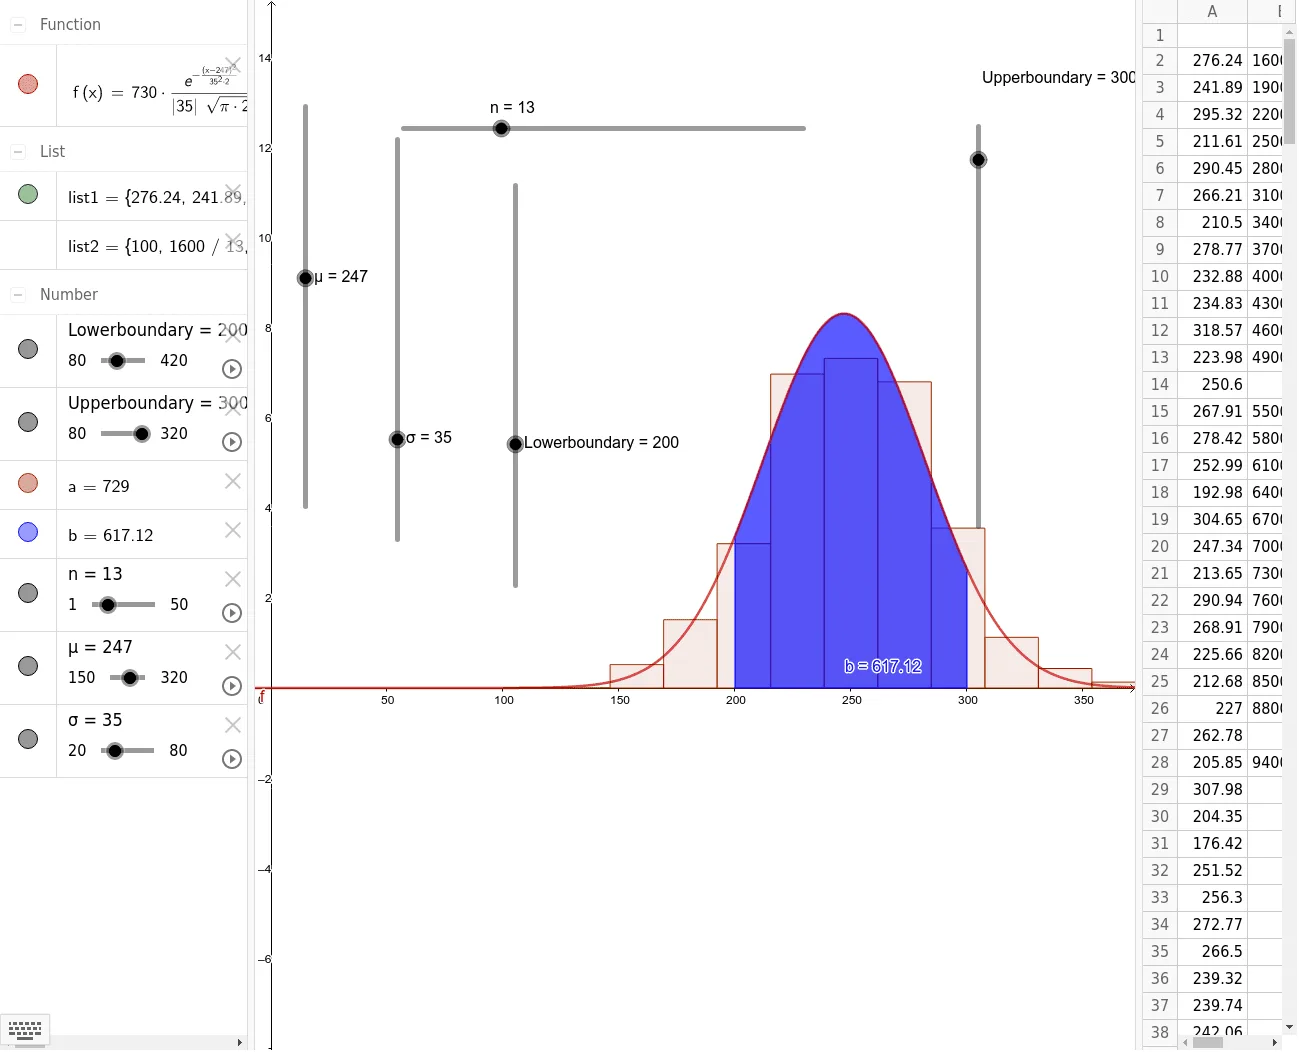
This example demonstrates how to create a normal distribution model and its graph using GeoGebra. Key math concepts include normal distribution, mean, standard deviation, histogram, and integral. Construction highlights involve commands like Mean, SD, Histogram, and Integral. Suitable for high school and above students to understand properties of normal distribution in probability and statistics.
GeoGebra Commands & Parameters
Mean(list1) → D2SD(list1) → D3Histogram(list2, list1, true, 1) → aIntegral(f, Lowerboundary, Upperboundary) → b
AI Drawing Prompt Reference
Create a normal distribution model graph. Start with a dataset, compute its mean and standard deviation. Display the data as a histogram, then overlay a bell-shaped normal distribution curve. Mark the mean on the x-axis. Shade the area under the curve between a lower and upper boundary to represent the integral, indicating the probability within that range. The graph should clearly show the relationship between the histogram and the theoretical normal curve.
The prompt above was compiled from the original drawing commands and is for reference only.