
Cosine Function with Slider for Phase Shift
Loading the math board and drawing, please wait…
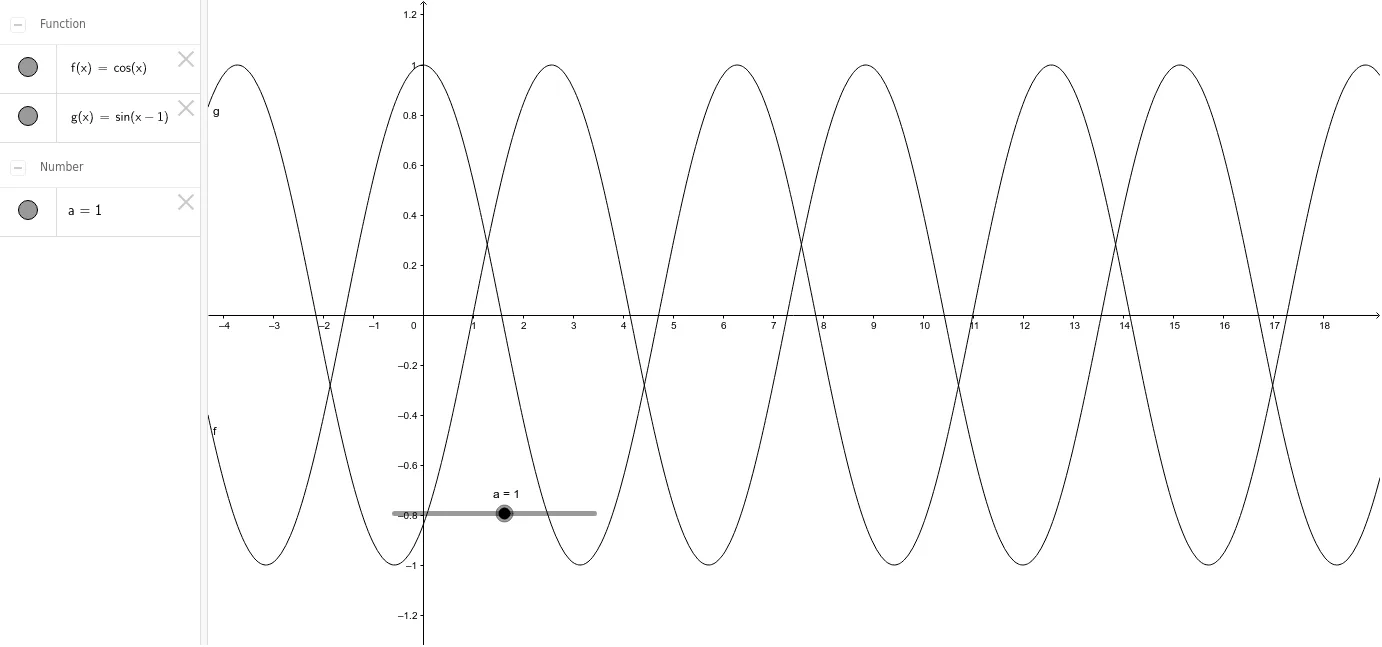
This example demonstrates a cosine function graph with a slider controlling the phase shift of a sine function. Key mathematical concepts include trigonometric functions, phase transformation, and function graphing. Construction involves GeoGebra commands a, f, g to create the graph. Suitable for high school mathematics teaching or student practice to understand trigonometric function transformations and image properties.
GeoGebra Commands & Parameters
Numeric a(1.0)f(x) = cos(x)g(x) = sin(x - a)
AI Drawing Prompt Reference
Draw a cosine function graph and add a slider to control the phase shift of a sine function. First, plot the basic cosine curve, then adjust the sine function's phase based on the slider's value to demonstrate phase transformation. The slider's value modifies the sine function's horizontal coordinate to achieve a dynamic demonstration of phase shift.
The prompt above was compiled from the original drawing commands and is for reference only.