
Cosine Function - One Period
Loading the math board and drawing, please wait…
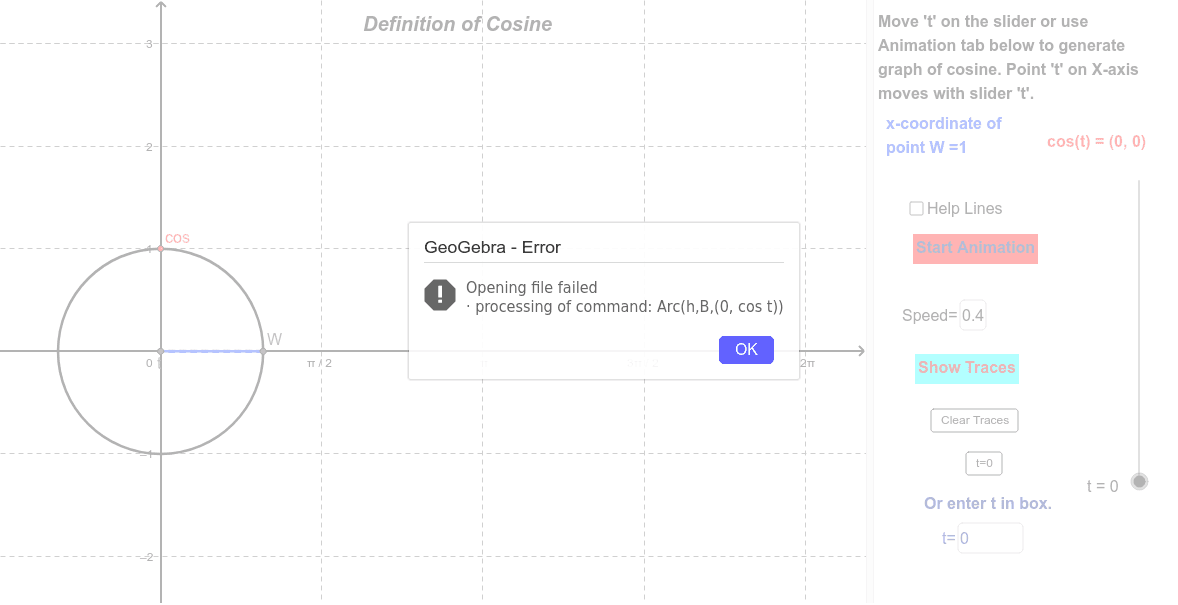
This example demonstrates the cosine function within one period. Key mathematical concepts include trigonometric functions and periodicity. Using GeoGebra commands such as Intersect, Circle, and OrthogonalLine, the cosine function's graph is constructed. Suitable for high school mathematics education and learning.
GeoGebra Commands & Parameters
Intersect(xAxis, yAxis) → ACircle(A, 1) → cOrthogonalLine(W, xAxis) → aSegment(B, W) → bSegment(B, A) → dSegment(A, W) → eTextfield(speed) → SPDTextfield(t) → tEqIf(togTr ≟ 1, "Stop Traces", "Show Traces") → ControlTracesIf(togA ≟ 1, "Stop Animation", "Start Animation") → ToggleAnimationCircle(A, B) → hMod(t, 1.5707963267948966) → tmArc(h, B, (0, cos(t))) → k
AI Drawing Prompt Reference
Draw the cosine function within one period. Start by drawing the coordinate axes, then draw a unit circle centered at the origin. Next, draw a line parallel to the positive x-axis. Then, draw a perpendicular line segment from a point on the circle to the parallel line, and draw a line segment from the origin to this perpendicular line segment, as well as a line segment from the origin to a point on the circle. Finally, dynamically draw the cosine function based on the parameter t.
The prompt above was compiled from the original drawing commands and is for reference only.