
Cosine Function Graph by Kirsty Watts
Loading the math board and drawing, please wait…
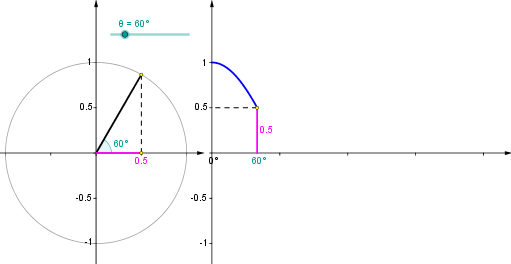
This example demonstrates the graph of the cosine function. It involves the core mathematical concept of trigonometric functions. Using GeoGebra commands such as Point, Rotate, Angle, Segment, Circle, Vector, Sequence, and Function, the cosine function graph is constructed. Suitable for high school mathematics education and learning.
GeoGebra Commands & Parameters
Point(Ray[(0, 0), (-1, 0)]) → BRotate(A, θ, B) → PRotate(A, θ, B) → A'Angle(A, B, A') → αRotate(A, θ, B) → A'_1Angle(A, B, A'_1) → βSegment(Q, (x(Q), 0)) → eSegment((0, 0), (x(Q), 0)) → gCircle(B, A) → cSegment(B, P) → aVector((x(B), y(Corner[1])), (x(B), y(Corner[4]))) → uVector((0, y(Corner[1])), (0, y(Corner[4]))) → wVector((0, 0), (x(Corner[2]), 0)) → zSequence(Segment[((0.75 * i), 0), ((0.75 * i), -0.025)], i, 1, 4) → list1Segment(B, (x(P), 0)) → bSegment(P, (x(P), 0)) → hFunction(cos((120° * x)), 0, x(Q)) → fVector(B - (1.2, 0), B + (1.2, 0)) → vSequence(Segment[(0, (0.5 * i) - 1), (-0.025, (0.5 * i) - 1)], i, 0, 4) → list2Sequence(Segment[(x(B), (0.5 * i) - 1), (x(B) - 0.025, (0.5 * i) - 1)], i, 0, 4) → list3Sequence(Segment[B + ((0.5 * i) - 1, 0), B + ((0.5 * i) - 1, -0.025)], i, 0, 4) → list4Segment(Q, (0, y(Q))) → dPoint(Ray[(0, 0), (-1, 0)]) → B_1Rotate(A_1, θ, B_1) → P_1Rotate(A_1, θ, B_1) → A'_2Rotate(A_1, θ, B_1) → A'_3Circle(B_1, A_1) → c_1Segment(B_1, P_1) → a_1