
Cosine Function Derivative Trace Visualization
Loading the math board and drawing, please wait…
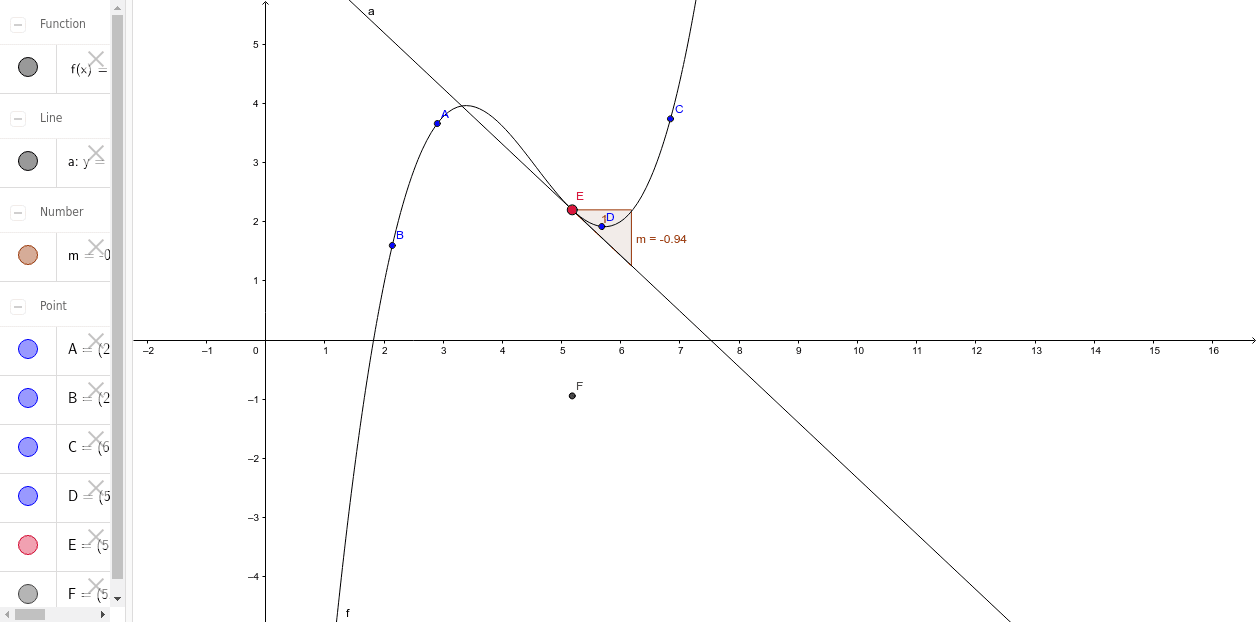
This GeoGebra example demonstrates the trace formed by the slopes of tangents to the cosine function f(x)=cos(x) at every point in its domain. By constructing a movable point A on the function curve and drawing the tangent line at that point, then using the Slope command to obtain the tangent's slope, students can observe the pattern of slope changes as point A moves—this pattern exactly represents the derivative -sin(x) of the cosine function. The construction uses GeoGebra commands including FitPoly, Point, Tangent, and Slope to visualize the geometric meaning of derivatives: the slope of the tangent line at a point on the curve. Ideal for high school mathematics teaching of 'Derivatives and Their Applications' or introductory calculus courses, helping students understand derivatives as 'instantaneous rates of change'.
GeoGebra Commands & Parameters
FitPoly({A, B, C, D}, 3) → fPoint(f) → ETangent(E, f) → aSlope(a) → m
AI Drawing Prompt Reference
Draw the cosine function and place a movable point on the curve. From this point, draw a tangent line and display its slope. As the point moves, the slope forms a new curve representing the derivative of the cosine function, which is the negative sine function.
The prompt above was compiled from the original drawing commands and is for reference only.