
Correlations Practice: Scatterplots and Correlation Coefficients
Loading the math board and drawing, please wait…
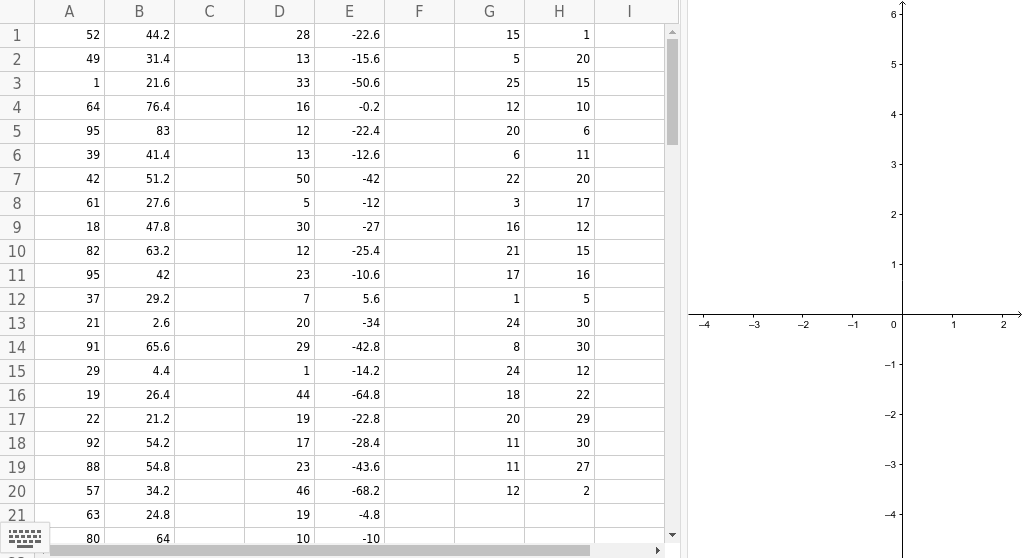
① This example demonstrates correlation phenomena through a set of predefined data points (objects A1 to H7) on a scatterplot, helping learners visually distinguish positive, negative, and zero correlations. ② Core mathematical concepts include correlation coefficients (e.g., Pearson's r), linear fitting, hypothesis testing (e.g., significance tests), and power functions in data modeling, along with fractions and translations as supporting operations. ③ Construction highlights: GeoGebra objects are created as points (A1, B1, D1, etc.), possibly using translation and special point markers to organize data; sliders or dynamic parameters may adjust data distribution to observe correlation changes, though the summary lists only object names without explicit commands. ④ Suitable for high school or introductory college statistics courses, this example serves as a classroom demonstration or self-paced practice to reinforce the distinction between correlation and causation and to build data interpretation skills.
GeoGebra Commands & Parameters
5244.228-22.61514931.413-15.6520121.633-50.625156476.416-0.21210958312-22.42063941.413-12.66114251.250-4222206127.65-123171847.830-2716128263.212-25.42115
AI Drawing Prompt Reference
Create a scatterplot with multiple data points showing positive, negative, and zero correlations. Include a fitted trend line and display correlation coefficients. Use distinct colors or shapes for points, with some points translated to create symmetric patterns. Add sliders to adjust point positions and observe changes in correlation. The plot is for statistics education, highlighting correlation vs. causation.
The prompt above was compiled from the original drawing commands and is for reference only.