
Correlation Quiz Data
Loading the math board and drawing, please wait…
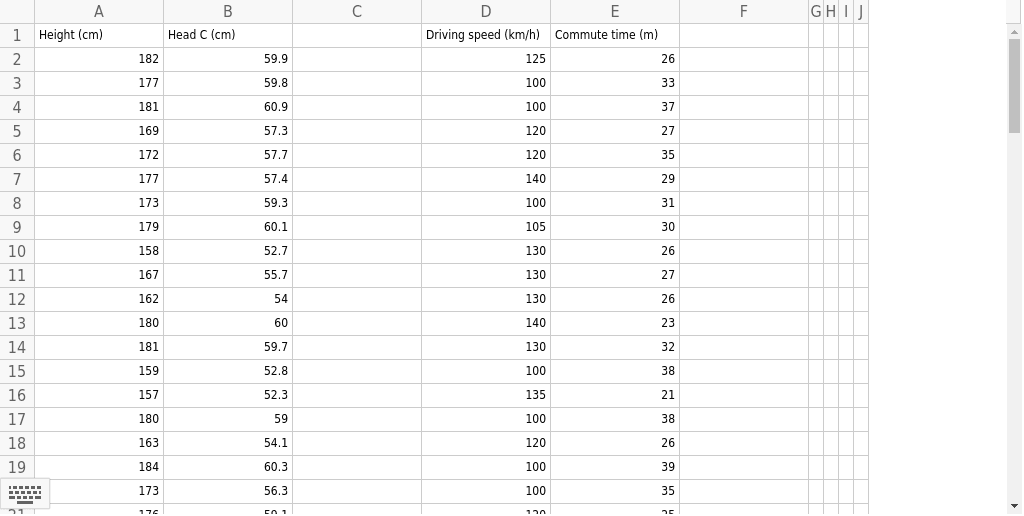
This example demonstrates correlation quiz data, involving the concept of correlation. By constructing objects such as A1, B1, D1, E1, etc., as described in the construction summary, one can understand how to use GeoGebra to plot correlation data points. Suitable for high school mathematics education, particularly in statistics and probability & statistics courses.
GeoGebra Commands & Parameters
18259.91252617759.81003318160.91003716957.31202717257.71203517757.41402917359.31003117960.11053015852.71302616755.7130271625413026180601402318159.71303215952.81003815752.313521
AI Drawing Prompt Reference
Plot a set of data points to show the correlation between test scores and students' ages from a statistics quiz. First, draw the x-axis for ages and the y-axis for scores. Then, input each student's age and score, such as 182 years old corresponding to 59.9 points, 125 years old corresponding to 26 points, and so on, for a total of 44 points.
The prompt above was compiled from the original drawing commands and is for reference only.