
Percentage Contexts: IM 7.4.11 Lesson
Loading the math board and drawing, please wait…
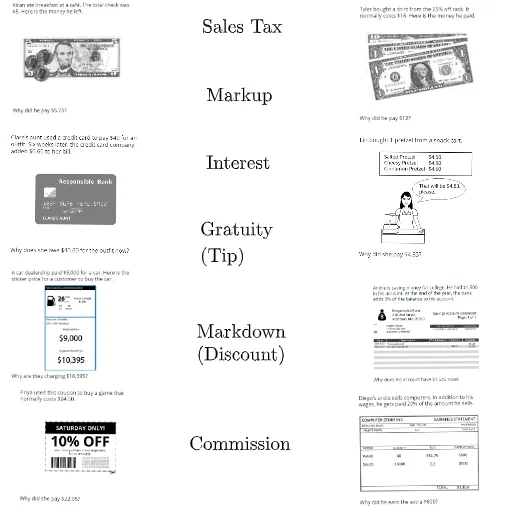
This GeoGebra example is an interactive lesson from Illustrative Mathematics Grade 7, Unit 4, Lesson 11, titled 'Percentage Contexts'. It demonstrates how percentages are used in real-world scenarios through a series of embedded images and text prompts. The core mathematical concepts include understanding the meaning of percentages, converting between percentages and decimals, and solving problems such as finding a percentage of a quantity or determining the whole given a part and its percentage. The construction uses multiple text objects (text1 to text6) and picture objects (pic1 to pic8), along with points labeled A through P, to create distinct visual contexts for each percentage problem. This resource is suitable for middle school students (around grade 7) learning about percentages, and can be used by teachers for classroom demonstrations or by students for independent exploration. It helps learners connect abstract percentage calculations to practical situations like discounts, taxes, or data interpretation.
GeoGebra Commands & Parameters
Point A(-22.879369350502778, 1.3078733709283519)Point B(-13.86892851535254, 1.3303326058974632)Point C(3.051312228488058, 0.7696834273208797)Point D(12.051312228488058, 0.7696834273208797)Point E(-23, -9)Point F(-13.48671283831389, -9.051312228488062)Point G(3.0435819943116567, -9.496547605082906)Point H(11.99243464262912, -9.547859833570968)Point I(-23, -19)Point J(-13.897210666218358, -19)Point K(4.180181255225355, -19)Point L(12.410662704709994, -18.948687771511945)Point M(-22.33294102965523, -28.17900434419106)Point N(-13.984031388583528, -28.235122142133935)Point O(3.128869026737296, -28.435565486631358)Point P(12.402932470533607, -28.328135460200432)
AI Drawing Prompt Reference
Create an interactive lesson layout for teaching percentages to seventh graders. Arrange eight picture frames in two rows at the top, four per row, each showing a real-life context like discounts or taxes. Below each frame, place a text label for a percentage question. Then add two rows of four points each beneath the text, serving as interactive markers. The overall structure has four horizontal bands: pictures, texts, then two rows of points, all evenly spaced and aligned, on a clean white background for classroom use.
The prompt above was compiled from the original drawing commands and is for reference only.