
Correlation with Same Standard Deviation
Loading the math board and drawing, please wait…
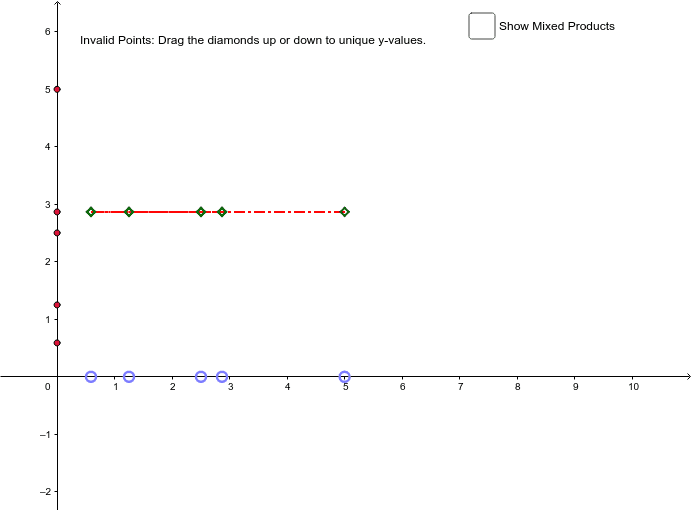
When X and Y values come from the same data set, their standard deviations are equal. This example uses GeoGebra to demonstrate this and explore the meaning of the correlation coefficient. Commands used include Point, Mirror, FitLineY, MeanX, OrthogonalLine, PMCC, Segment, RectanglefromDiagonal, If, etc. Suitable for high school math education to help students understand the concepts of correlation and standard deviation.
GeoGebra Commands & Parameters
Point(xAxis) → AMirror(A, y = x) → A'Point(xAxis) → EMirror(E, y = x) → E'Point(xAxis) → DMirror(D, y = x) → D'Point(xAxis) → CMirror(C, y = x) → C'Point(xAxis) → BMirror(B, y = x) → B'Point({(x(E), y(A')), (x(E), y(B')), (x(E), y(C')), (x(E), y(D')), (x(E), y(E'))}) → KPoint({(x(D), y(A')), (x(D), y(B')), (x(D), y(C')), (x(D), y(D')), (x(D), y(E'))}) → JPoint({(x(C), y(A')), (x(C), y(B')), (x(C), y(C')), (x(C), y(D')), (x(C), y(E'))}) → IPoint({(x(B), y(A')), (x(B), y(B')), (x(B), y(C')), (x(B), y(D')), (x(B), y(E'))}) → HPoint({(x(A), y(A')), (x(A), y(B')), (x(A), y(C')), (x(A), y(D')), (x(A), y(E'))}) → GFitLineY({G, H, I, J, K}) → bMeanX({A, B, C, D, E}) → aOrthogonalLine(F, yAxis) → lPMCC({G, H, I, J, K}) → cOrthogonalLine(F, xAxis) → mSegment(G, H) → dSegment(G, I) → eSegment(G, J) → fSegment(G, K) → gSegment(H, I) → hSegment(H, J) → iSegment(H, K) → jSegment(I, J) → kSegment(I, K) → nSegment(J, K) → pRectanglefromDiagonal(F, G) → poly1RectanglefromDiagonal(F, H) → poly2RectanglefromDiagonal(F, I) → poly3RectanglefromDiagonal(F, J) → poly4RectanglefromDiagonal(F, K) → poly5If(valid, Text["Correlation: " + c, true], Text["Invalid Points: Drag the diamonds up or down to unique y-values."]) → text3