
Correlation Q1
Loading the math board and drawing, please wait…
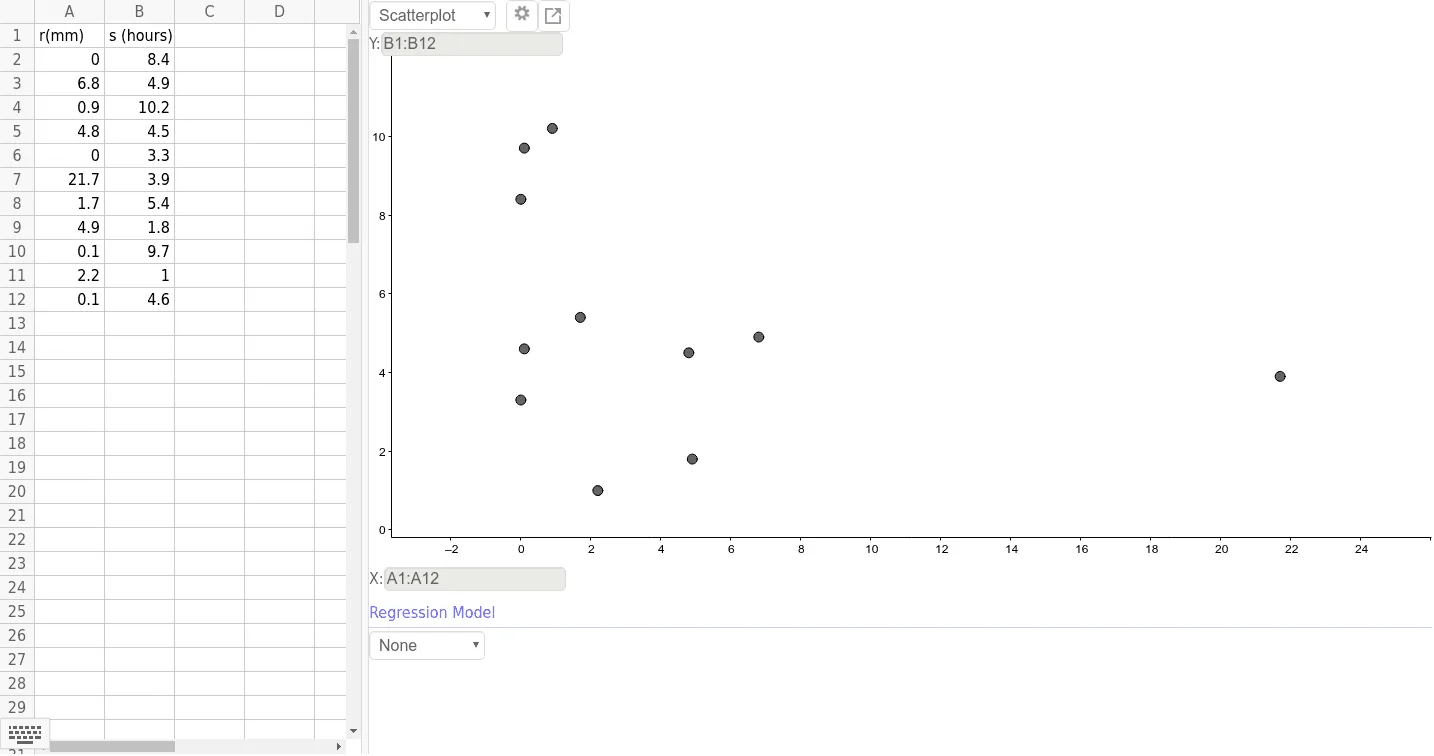
This example demonstrates the correlation between two variables. It involves the core mathematical concept of correlation in statistics. By examining the objects constructed, such as A1, B1, etc., one can understand how to perform correlation analysis using GeoGebra. Suitable for high school and above students or teachers.
GeoGebra Commands & Parameters
06.80.94.8021.71.74.90.12.20.18.44.910.24.53.33.95.41.89.714.6
AI Drawing Prompt Reference
Draw a scatter plot and linear regression line to show the correlation between two variables. Start by plotting points A1 to B10, then calculate the linear correlation coefficient for these points.
The prompt above was compiled from the original drawing commands and is for reference only.