
Correlation Dynamic Demo
Loading the math board and drawing, please wait…
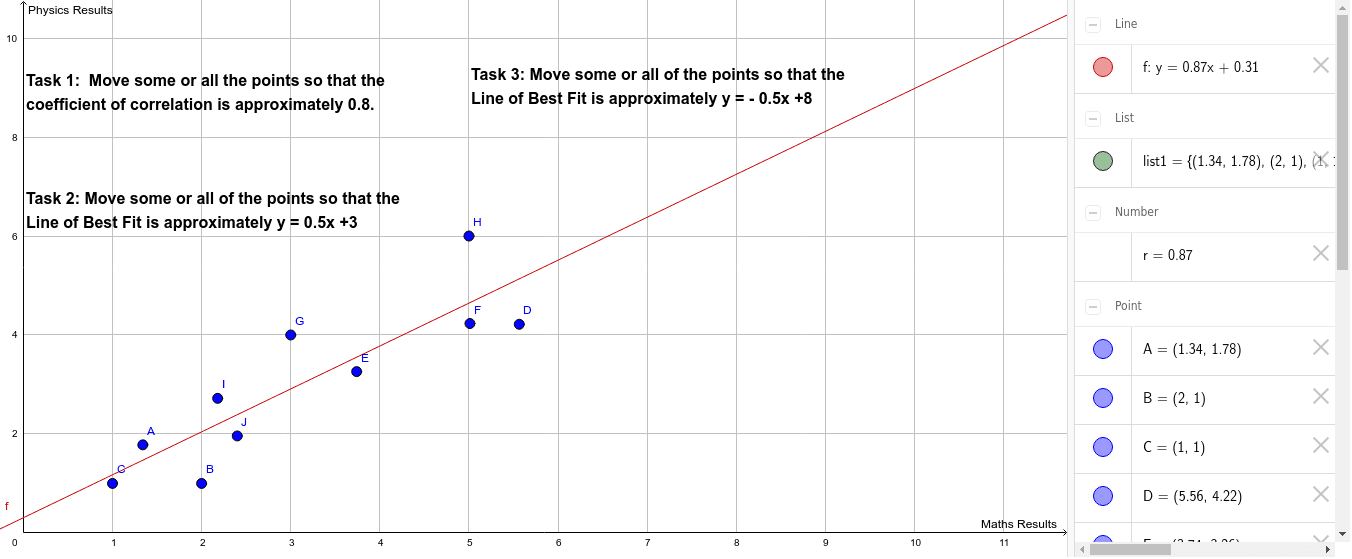
This example demonstrates the dynamic behavior of data correlation, including correlation coefficient (PMCC), linear regression (fitting lines), integral calculus, straight lines, scalene triangles, and real number operations. It utilizes GeoGebra commands like FitLineY and PMCC, along with objects A-J, list1, f, r. Suitable for high school mathematics education, illustrating the integration of statistical analysis and coordinate geometry.
GeoGebra Commands & Parameters
FitLineY(list1) → fPMCC(list1) → r
AI Drawing Prompt Reference
Demonstrate the dynamic behavior of data correlation, including correlation coefficient, linear regression fitting lines, integral calculus, scalene triangles, and real number operations. Plot a linear regression line for data points, labeling its slope, and calculate and display the correlation coefficient. Add an arbitrary triangle and show the integral calculation process, all elements clearly presented in a coordinate system.
The prompt above was compiled from the original drawing commands and is for reference only.