
Correlation Comparison
Loading the math board and drawing, please wait…
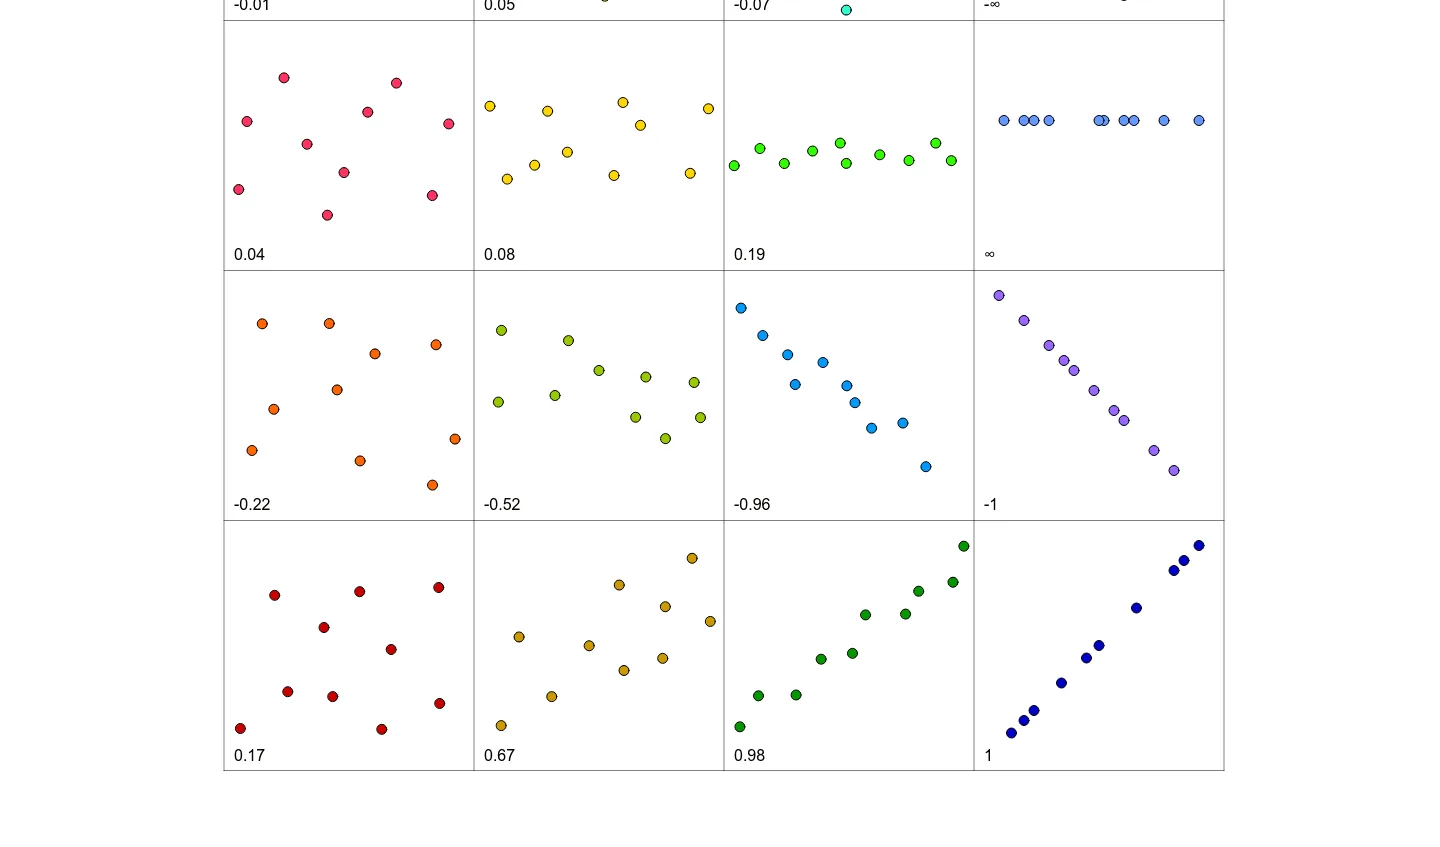
This example demonstrates how to compare the correlation between two data sets. Key mathematical concepts include correlation coefficient, intersection, ratios, cosine, parametric curves, and similarity transformation. Using GeoGebra commands such as PMCC, Intersect, Segment, and Point, the example constructs visual representations of these concepts. Suitable for high school mathematics education and learning.
GeoGebra Commands & Parameters
PMCC({A, B, C, D, E, F, G, H, I, J}) → aPMCC({K, L, M, N, O, P, Q, R, S, T}) → bPMCC({G_1, H_1, I_1, J_1, K_1, L_1, M_1, N_1, O_1, P_1}) → dPMCC({U, V, W, Z, A_1, B_1, C_1, D_1, E_1, F_1}) → cPMCC({Q_1, R_1, S_1, T_1, U_1, V_1, W_1, Z_1, A_2, B_2}) → ePMCC({C_2, D_2, E_2, F_2, G_2, H_2, I_2, J_2, K_2, L_2}) → mPMCC({M_2, N_2, O_2, P_2, Q_2, R_2, S_2, T_2, U_2, V_2}) → nPMCC({W_2, Z_2, A_3, B_3, C_3, D_3, E_3, F_3, G_3, H_3}) → oPMCC({I_3, J_3, K_3, L_3, M_3, N_3, O_3, P_3, Q_3, R_3}) → pPMCC({S_3, T_3, U_3, V_3, W_3, Z_3, A_4, B_4, C_4, D_4}) → qPMCC({E_4, F_4, G_4, H_4, I_4, J_4, K_4, L_4, M_4, N_4}) → rPMCC({O_4, P_4, Q_4, R_4, S_4, T_4, U_4, V_4, W_4, Z_4}) → sPMCC({A_5, B_5, C_5, D_5, E_5, F_5, G_5, H_5, I_5, J_5}) → tPMCC({K_5, L_5, M_5, N_5, O_5, P_5, Q_5, R_5, S_5, T_5}) → uPMCC({U_5, V_5, W_5, Z_5, A_6, B_6, C_6, D_6, E_6, F_6}) → vPMCC({G_6, H_6, I_6, J_6, K_6, L_6, M_6, N_6, O_6, P_6}) → wPMCC({Q_6, R_6, S_6, T_6, U_6, V_6, W_6, Z_6, A_7, B_7}) → a_1PMCC({C_7, D_7, E_7, F_7, G_7, H_7, I_7, J_7, K_7, L_7}) → b_1PMCC({W_7, Z_7, A_8, B_8, C_8, D_8, E_8, F_8, G_8, H_8}) → c_1PMCC({M_7, N_7, O_7, P_7, Q_7, R_7, S_7, T_7, U_7, V_7}) → d_1Intersect(xAxis, yAxis) → I_8Segment(I_8, J_8) → fSegment(K_8, L_8) → gPoint(yAxis) → M_8Segment(M_8, N_8) → hPoint(yAxis) → O_8Segment(O_8, P_8) → iPoint(yAxis) → Q_8Segment(Q_8, R_8) → jPoint(yAxis) → S_8Segment(S_8, T_8) → kSegment(I_8, S_8) → lSegment(J_8, T_8) → f_1Segment(U_8, V_8) → g_1Segment(W_8, Z_8) → h_1Segment(A_9, B_9) → i_1