
Correlation and the Least Squares Regression Line (LSRL)
Loading the math board and drawing, please wait…
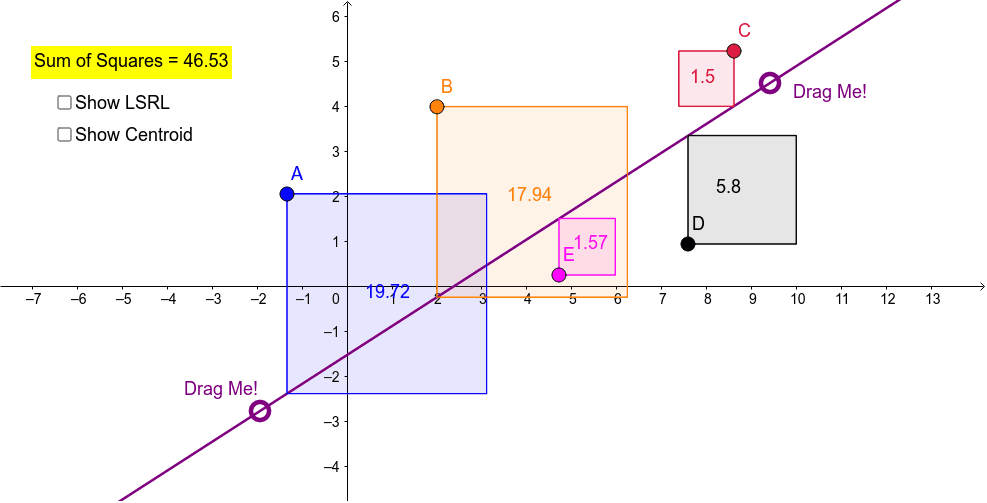
This GeoGebra example dynamically illustrates the close relationship between correlation and the equation of the Least Squares Regression Line (LSRL), explaining why it is called 'least squares'. The core mathematical concepts include correlation coefficient, sum of squared residuals, linear regression, and the vertical distances from data points to the fitted line. Construction highlights: using commands such as Line, OrthogonalLine, Intersect, Polygon, Sum, and FitLineY, the applet builds multiple points (A to P), lines (a to s), polygons (poly1 to poly4), and intersection points (H, I, J, K, etc.) to visualize the squared residuals. Suitable for high school and college statistics courses, this example helps students grasp the geometric meaning of regression and the intuitive interpretation of correlation.
GeoGebra Commands & Parameters
Line(F, H) → aOrthogonalLine(A, xAxis) → bOrthogonalLine(E, xAxis) → cOrthogonalLine(B, xAxis) → dOrthogonalLine(D, xAxis) → eOrthogonalLine(C, xAxis) → fIntersect(b, a) → H_1Intersect(c, a) → IIntersect(d, a) → JIntersect(a, f) → KIntersect(e, a) → LPolygon(A, H_1, 4) → poly1, g, h, i, j, M, NPolygon(I, E, 4) → poly2, k, l, m, n, O, PPolygon(B, J, 4) → poly3, p, q, r, s, Q, RPolygon(L, D, 4) → poly4, t, a_1, b_1, c_1, S, TPolygon(K, C, 4) → poly5, d_1, e_1, f_1, g_1, U, VSum(A1:A5) → A6FitLineY({A, B, C, D, E}) → h_1
AI Drawing Prompt Reference
Create a scatter plot with five data points and a fitted least-squares regression line. From each data point, draw a vertical line down to the x-axis, and mark where these vertical lines intersect the regression line. Using each data point, its foot on the x-axis, and the intersection point on the regression line as vertices, construct five rectangles that visually represent the vertical distances (residuals) from the points to the line. Also display the sum of the areas of these rectangles to illustrate the concept of least squares. The layout should clearly show the relationship among the points, the line, the vertical segments, and the rectangles.
The prompt above was compiled from the original drawing commands and is for reference only.