
Correlation and Regression Line
Loading the math board and drawing, please wait…
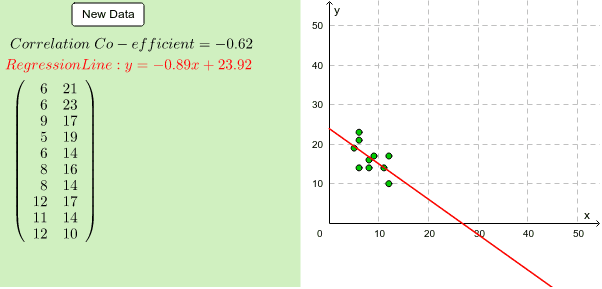
This example illustrates the correlation coefficient and regression line for a randomly generated data set. It involves core mathematical concepts like correlation analysis, regression modeling, and data statistics. Constructed using GeoGebra commands such as Random, Sequence, FitLineY, and PMCC. Suitable for high school mathematics education to understand data distribution and linear regression applications.
GeoGebra Commands & Parameters
Random(1, 2) → dRandom(1, 2) → aRandom(2, 8) → cRandom(1, 2) → bSequence(Random[0, 100], i, 1, 10) → RandlistMin(Randlist) → LeastMax(Randlist) → MostMedian(Randlist) → MedQ1(Randlist) → Q_1Q3(Randlist) → Q_3Sort(Randlist) → SortedSegment((Least, 2), (Least, 4)) → minsegSegment((Least, 3), (Q_1, 3)) → TailsegSegment((Q_1, 2), (Q_1, 4)) → q1seqSegment((Q_3, 2), (Q_3, 4)) → q3seqSegment((Q_1, 2), (Q_3, 2)) → midsegbottomSegment((Q_1, 4), (Q_3, 4)) → midsegtopSegment((Most, 2), (Most, 4)) → maxsegSegment((Most, 3), (Q_3, 3)) → headsegSegment((Med, 2), (Med, 4)) → medsegFrequencyTable(classlist, Randlist) → freqFrequency(true, classlist, Sorted) → CFreqPointList(Sequence[{Element[classlist, i], Element[CFreq, i]}, i, 1, 20]) → OgivepointsSequence({(i * a) + Random[0, c], (25 * (d - 1)) + ((-1)^(d + 1) * ((i * b) + Random[0, c]))}, i, 1, 10) → BVDSetPointList(BVDSet) → BVDPointsFitLineY(BVDPoints) → bflFunction(((-(x(bfl) / y(bfl))) * x) - z(bfl) / y(bfl), 0, 100) → bflfnPMCC(BVDPoints) → ccCorner(1, 1) → Cnr1Corner(1, 2) → Cnr2Corner(1, 3) → Cnr3Corner(1, 4) → Cnr4Polygon(CN1, CN2, CN3, CN4) → Panel, cn1, cn2, cn3, cn4