
Correlation and Regression Analysis by GMMDC
Loading the math board and drawing, please wait…
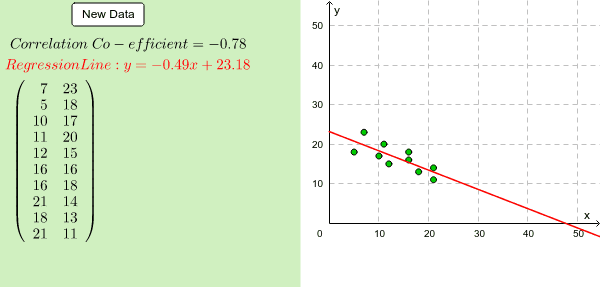
This example demonstrates the concepts of correlation and regression analysis. It generates random data points to illustrate how to calculate the correlation coefficient, plot a scatter diagram, fit a linear regression line, and analyze the distribution of data. GeoGebra commands such as Random, Sequence, and FitLineY are used. Suitable for high school mathematics education, helping students understand the relationship between data and basic methods of statistical analysis.
GeoGebra Commands & Parameters
Random(1, 2) → dRandom(1, 2) → aRandom(2, 8) → cRandom(1, 2) → bSequence(Random[0, 100], i, 1, 10) → RandlistMin(Randlist) → LeastMax(Randlist) → MostMedian(Randlist) → MedQ1(Randlist) → Q_1Q3(Randlist) → Q_3Sort(Randlist) → SortedSegment((Least, 2), (Least, 4)) → minsegSegment((Least, 3), (Q_1, 3)) → TailsegSegment((Q_1, 2), (Q_1, 4)) → q1seqSegment((Q_3, 2), (Q_3, 4)) → q3seqSegment((Q_1, 2), (Q_3, 2)) → midsegbottomSegment((Q_1, 4), (Q_3, 4)) → midsegtopSegment((Most, 2), (Most, 4)) → maxsegSegment((Most, 3), (Q_3, 3)) → headsegSegment((Med, 2), (Med, 4)) → medsegFrequencyTable(classlist, Randlist) → freqFrequency(true, classlist, Sorted) → CFreqPointList(Sequence[{Element[classlist, i], Element[CFreq, i]}, i, 1, 20]) → OgivepointsSequence({(i * a) + Random[0, c], (25 * (d - 1)) + ((-1)^(d + 1) * ((i * b) + Random[0, c]))}, i, 1, 10) → BVDSetPointList(BVDSet) → BVDPointsFitLineY(BVDPoints) → bflFunction(((-(x(bfl) / y(bfl))) * x) - z(bfl) / y(bfl), 0, 100) → bflfnPMCC(BVDPoints) → ccCorner(1, 1) → Cnr1Corner(1, 2) → Cnr2Corner(1, 3) → Cnr3Corner(1, 4) → Cnr4Polygon(CN1, CN2, CN3, CN4) → Panel, cn1, cn2, cn3, cn4
AI Drawing Prompt Reference
Generate 10 random data points, plot a scatter diagram, and fit a linear regression line. Also, display the data distribution, including the minimum, first quartile, median, third quartile, and maximum values, using horizontal line segments to indicate these statistics. Calculate and show the correlation coefficient, finally dividing the graphic area into four parts and filling them with different colors.
The prompt above was compiled from the original drawing commands and is for reference only.