
Correlation Analysis on Variable-sized Data Set
Loading the math board and drawing, please wait…
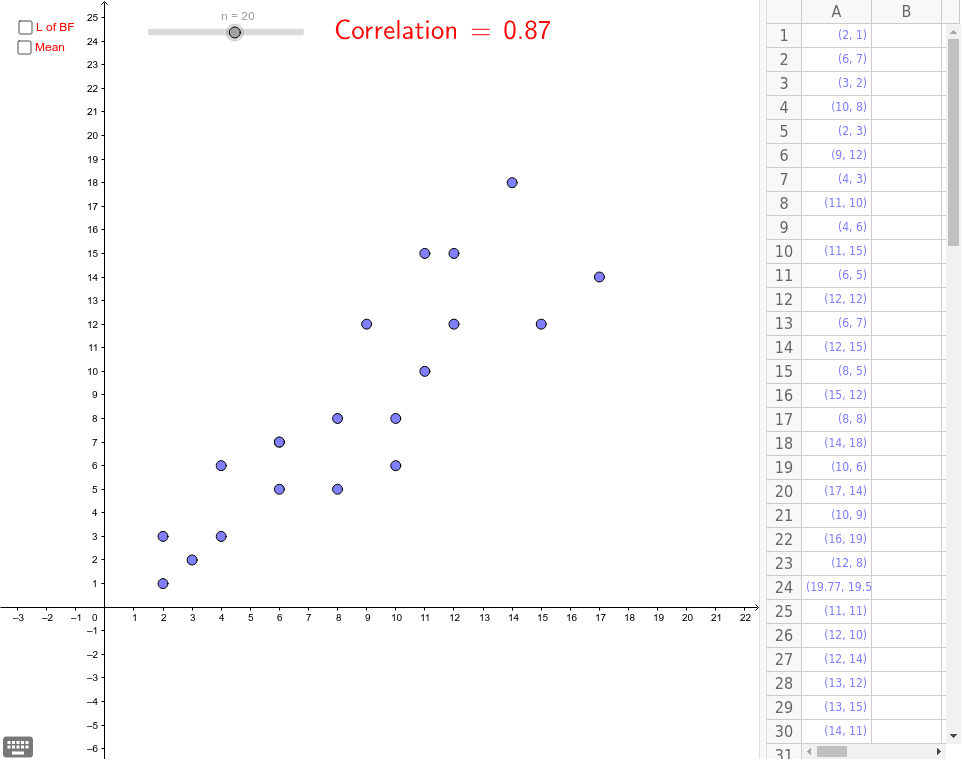
This example demonstrates how to change the size of a data set by dragging points and analyze the correlation between them. Key mathematical concepts include correlation, means, and linear regression. Using GeoGebra commands such as Sequence, FitLineY, and PMCC, a dynamic data set and linear regression line can be constructed. Suitable for high school and above students to learn about correlation analysis and statistics.
GeoGebra Commands & Parameters
Sequence(x(Element[MyPoints, k]), k, 1, n) → M_XSequence(y(Element[MyPoints, k]), k, 1, n) → M_YFitLineY(Sequence[(Element[M_X, k], Element[M_Y, k]), k, 1, n]) → LoBFPMCC(Sequence[(Element[M_X, k], Element[M_Y, k]), k, 1, n]) → CorrelationLaTeX(Correlation, true, true) → text1
AI Drawing Prompt Reference
Create a dynamic correlation analysis diagram showing a variable-sized data set with draggable points. Display how the size of the data set changes and analyze the correlation between the points. Include a linear regression line fitted through the data points and label the correlation coefficient, suitable for high school and above students to understand correlation analysis and statistics.
The prompt above was compiled from the original drawing commands and is for reference only.