
Coronavirus 2020: Exponential Growth Model
Loading the math board and drawing, please wait…
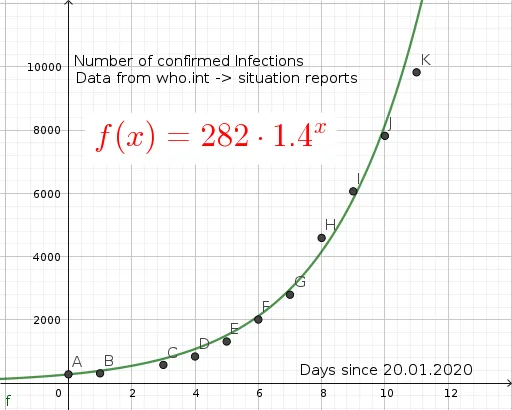
This example uses a simple exponential model to demonstrate the outbreak of 2019-nCoV. It involves the core mathematical concept of exponential functions. Using GeoGebra objects like A1, A2, A3, etc., the example constructs an exponential growth graph. Suitable for high school mathematics education, particularly for teaching exponential functions and model fitting.
GeoGebra Commands & Parameters
012345678910112823145818461320201427984593606578189826(A1, B1)(A2, B2)(A4, B4)(A5, B5)(A6, B6)(A7, B7)(A8, B8)(A9, B9)(A10, B10)(A11, B11)(A12, B12){A, B, C, D, E, F, G, H, I, J, K}f(x) = (282 * 1.4^(x))ℯ^(0.35)
AI Drawing Prompt Reference
Draw a graph showing the exponential growth model of the 2019-nCoV outbreak, including an exponential function curve with time on the x-axis (0 to 11) and case numbers on the y-axis (282 to 9826), and mark actual data points (1 to 12) as scattered points to demonstrate the exponential growth pattern.
The prompt above was compiled from the original drawing commands and is for reference only.