
Corona3BlueOneBrown: Dynamic Simulation of the SIR Epidemic Model
Loading the math board and drawing, please wait…
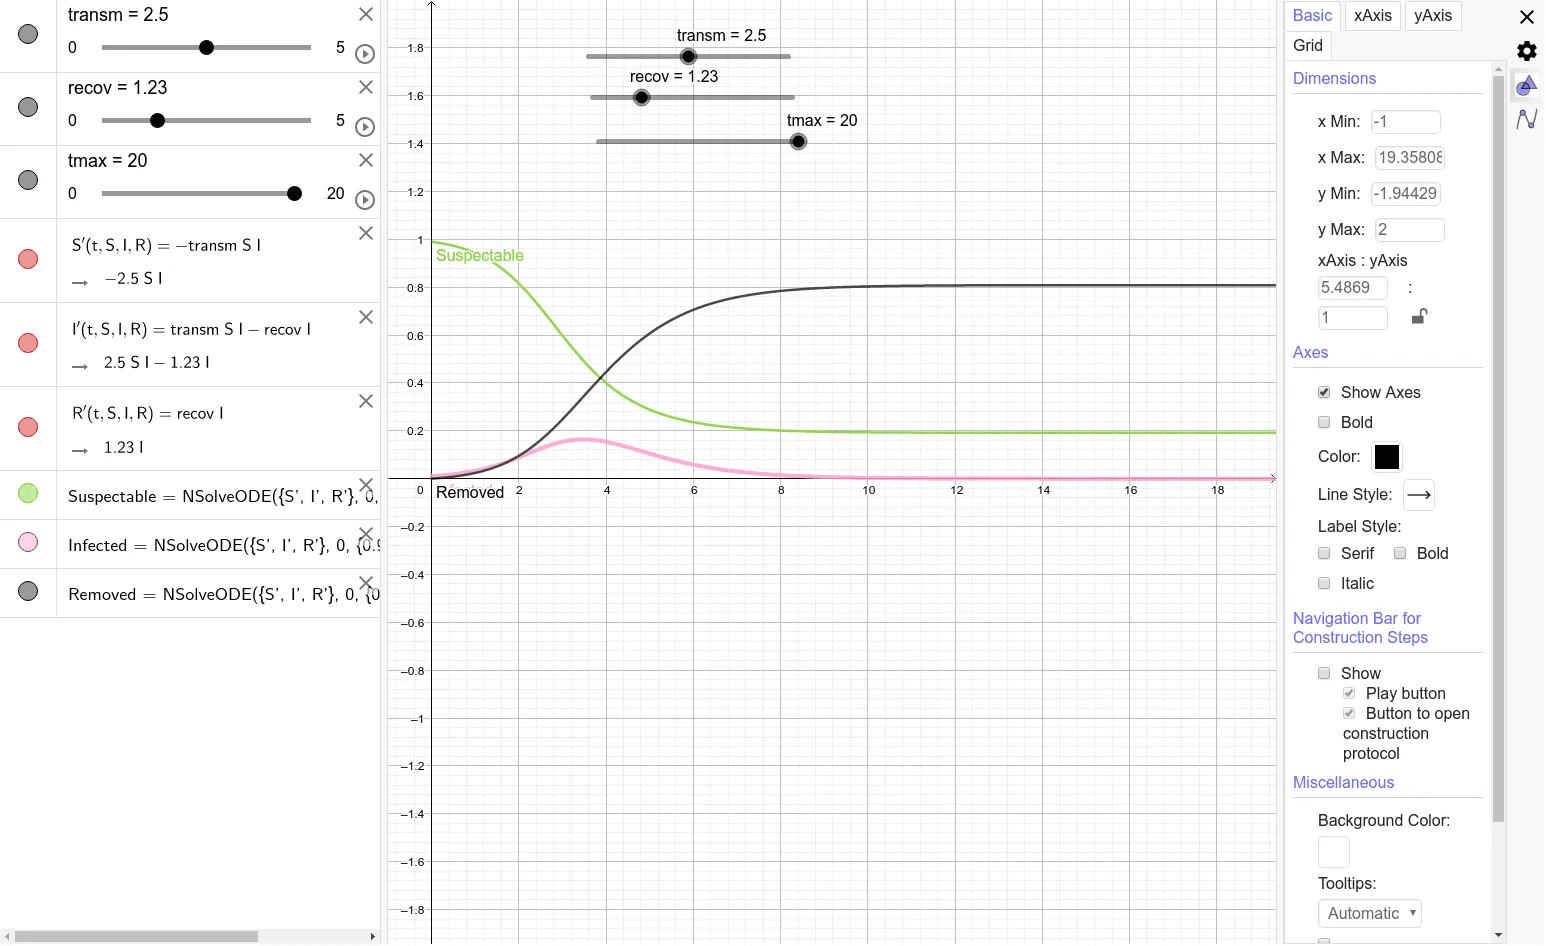
① This GeoGebra example dynamically simulates the SIR epidemic model, showing how the susceptible (S), infected (I), and recovered (R) populations evolve over time, providing an intuitive visualization of disease spread and decline. ② Core mathematical concepts include systems of ordinary differential equations, numerical integration methods (e.g., Euler or Runge-Kutta), parameter sensitivity analysis, and applications of differential equations in epidemiology. ③ Construction highlights: The NSolveODE command solves the coupled ODEs for S', I', and R', with parameters transm (transmission rate), recov (recovery rate), and tmax (simulation duration) controlled by sliders; the objects Suspectable, Infected, and Removed are plotted as dynamic curves. ④ Suitable for high school to undergraduate courses in mathematical modeling, calculus, or differential equations, and useful for public health education to explore the impact of interventions like social distancing or vaccination.
GeoGebra Commands & Parameters
NSolveODE({S', I', R'}, 0, {0.99, 0.01, 0}, tmax) → Suspectable, Infected, Removed