
Corona Virus Spread Model in February 2020
Loading the math board and drawing, please wait…
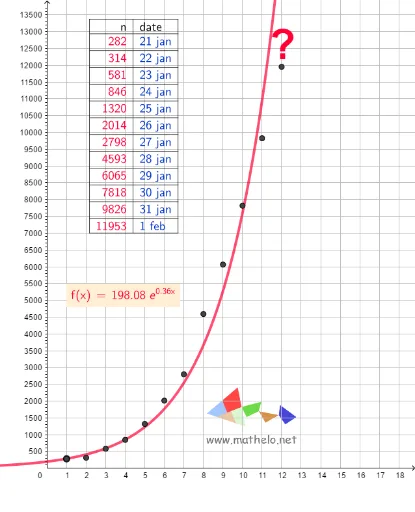
This example uses exponential functions to demonstrate the spread of the coronavirus in February 2020. Key mathematical concepts include exponential functions and statistics. GeoGebra commands such as TableText and FitExp are used to dynamically display data points and fitted curves. Suitable for high school students and researchers.
GeoGebra Commands & Parameters
TableText({{B1, C1}, {B2, C2}, {B3, C3}, {B4, C4}, {B5, C5}, {B6, C6}, {B7, C7}, {B8, C8}, {B9, C9}, {B10, C10}, {B11, C11}, {B12, C12}, {B13, C13}}, "|_rl") → tekst1FitExp(data1) → fLaTeX(f, true, true) → tekst2
AI Drawing Prompt Reference
Plot the coronavirus spread model for February 2020 using exponential functions to show the growth of infections over time. First, input the infection data points for each month, then fit an exponential curve, and finally display the equation of the fitted curve.
The prompt above was compiled from the original drawing commands and is for reference only.