
Copy of Quiz: Graphing Linear Equations (V1)
Loading the math board and drawing, please wait…
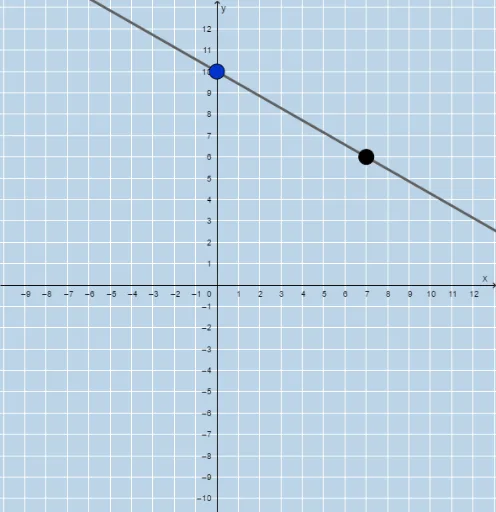
This interactive quiz example, titled 'Graphing Linear Equations (V1)', is designed to help students practice matching linear equations with their graphs on a coordinate plane. It demonstrates how random linear equations are generated and displayed, requiring learners to identify slopes, intercepts, and the correct line representation. Core mathematical concepts include linear equations, slope, y-intercept, graphing lines, and the relationship between algebraic form and geometric visualization. The construction uses GeoGebra commands such as Sequence, Union, Random, Point, Line, and FractionText to create randomized points, lines, and fractional coefficients, along with multiple buttons (button1, button2, button3) and text boxes (text1-text5) to present questions and provide interactive feedback. This resource is suitable for middle school or high school students learning linear functions, and can be used by teachers for in-class quizzes or self-paced practice to reinforce equation-to-graph and graph-to-equation skills.
GeoGebra Commands & Parameters
Sequence(i, i, -10, -1) → aSequence(i, i, -10, -1) → bSequence(i, i, 1, 10) → cUnion(b, c) → dRandom(-12, 12) → ePoint(x = 0) → ALine(A, B) → gFractionText(Slope[f]) → text1FractionText(f(0)) → text2
AI Drawing Prompt Reference
Draw a line passing through the origin with a slope and y-intercept generated by random numbers. First, create integer sequences from -10 to -1 and from 1 to 10, then merge them into sequence d. Generate a random number e between -12 and 12 as the slope, and create a point A at the origin on the y-axis. Draw a line g through point A with slope e. Finally, display the slope and y-intercept of line g in fraction form in text boxes text1 and text2.
The prompt above was compiled from the original drawing commands and is for reference only.