
Graphing Linear Inequalities with 2 Variables (Quiz) by kusai
Loading the math board and drawing, please wait…
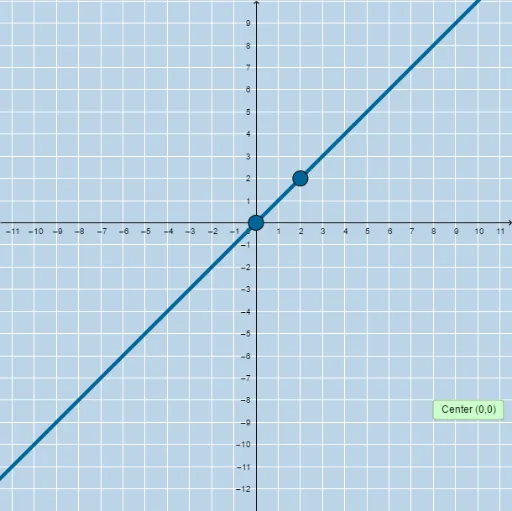
This example demonstrates how to graph the solution set of a linear inequality in a 2D coordinate system. Key math concepts include inequalities, linear equations, and region representation. GeoGebra commands used are Sequence, Union, Random, Line, FractionText, and Slope, with objects like a, b, c, d, m, e, f, A, B, i, button1, text1, etc. Suitable for high school students learning and practicing inequality graphing, as well as classroom demonstrations and quizzes.
GeoGebra Commands & Parameters
Sequence(i, i, -10, -1) → aSequence(i, i, -10, -1) → bSequence(i, i, 1, 10) → cUnion(b, c) → dRandom(-10, 10) → eLine(A, B) → iFractionText(Slope[f]) → text1FractionText(f(0)) → text2Random(1, 4) → symbolLine(A, B) → hSlope(i) → slope_i
AI Drawing Prompt Reference
Graph the solution set of a linear inequality in a 2D coordinate system to demonstrate key math concepts like inequalities, linear equations, and region representation. Generate two sets of coordinate points, merge them to create a background grid. Select two random points to determine a non-zero slope line, labeling its slope and y-intercept. Draw the boundary line corresponding to a randomly chosen inequality symbol (solid or dashed), resulting in a half-plane representing the inequality's solution set.
The prompt above was compiled from the original drawing commands and is for reference only.